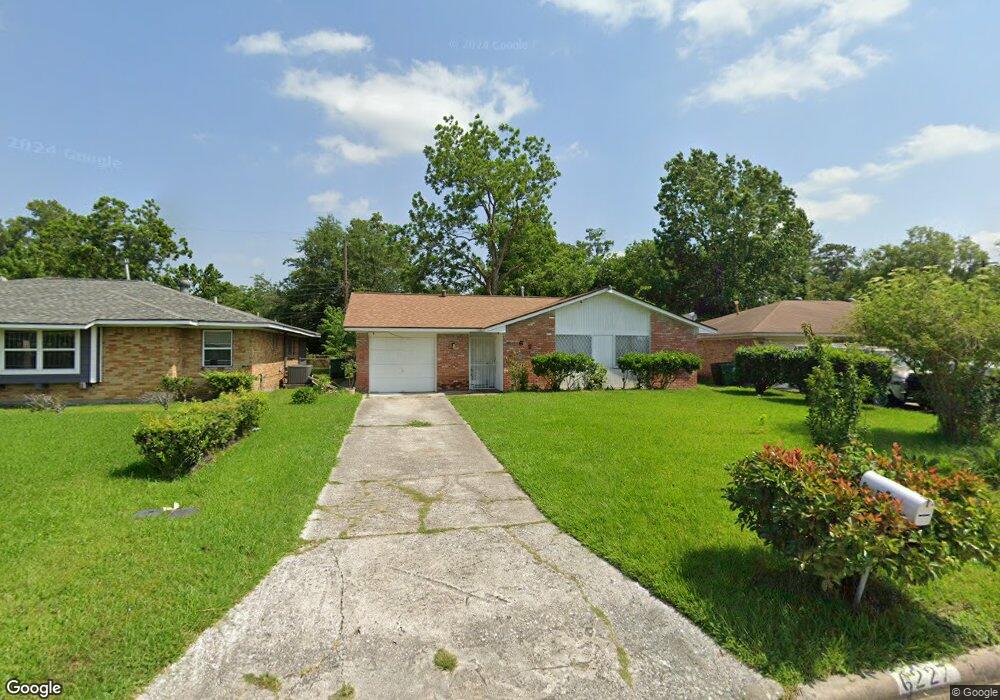
6227 Antha St Houston, TX 77016
East Little York NeighborhoodEstimated Value: $161,000 - $190,000
3
Beds
2
Baths
1,197
Sq Ft
$145/Sq Ft
Est. Value
About This Home
This home is located at 6227 Antha St, Houston, TX 77016 and is currently estimated at $173,464, approximately $144 per square foot. 6227 Antha St is a home located in Harris County with nearby schools including Shadydale Elementary School, Forest Brook Middle, and North Forest High School.
Ownership History
Date
Name
Owned For
Owner Type
Purchase Details
Closed on
Jun 16, 2016
Sold by
First Castle Homes Lp
Bought by
Benitez Isabel B
Current Estimated Value
Home Financials for this Owner
Home Financials are based on the most recent Mortgage that was taken out on this home.
Original Mortgage
$69,200
Outstanding Balance
$55,147
Interest Rate
3.61%
Mortgage Type
New Conventional
Estimated Equity
$118,317
Purchase Details
Closed on
Nov 12, 2015
Sold by
Hands Jack and Wells Fargo Bank Na
Bought by
First Castle Homes Lp
Purchase Details
Closed on
Mar 8, 2002
Sold by
Realwealth Inc
Bought by
Hands Jack
Home Financials for this Owner
Home Financials are based on the most recent Mortgage that was taken out on this home.
Original Mortgage
$67,925
Interest Rate
6.93%
Mortgage Type
Stand Alone First
Purchase Details
Closed on
Jan 1, 1998
Sold by
Thomas Barbara
Bought by
Gordon Linda
Create a Home Valuation Report for This Property
The Home Valuation Report is an in-depth analysis detailing your home's value as well as a comparison with similar homes in the area
Home Values in the Area
Average Home Value in this Area
Purchase History
| Date | Buyer | Sale Price | Title Company |
|---|---|---|---|
| Benitez Isabel B | -- | Capital Title | |
| First Castle Homes Lp | $44,500 | None Available | |
| Hands Jack | -- | Chicago Title | |
| Gordon Linda | -- | -- | |
| Gordon Linda | -- | -- |
Source: Public Records
Mortgage History
| Date | Status | Borrower | Loan Amount |
|---|---|---|---|
| Open | Benitez Isabel B | $69,200 | |
| Previous Owner | Hands Jack | $67,925 |
Source: Public Records
Tax History Compared to Growth
Tax History
| Year | Tax Paid | Tax Assessment Tax Assessment Total Assessment is a certain percentage of the fair market value that is determined by local assessors to be the total taxable value of land and additions on the property. | Land | Improvement |
|---|---|---|---|---|
| 2025 | $1,060 | $156,164 | $45,427 | $110,737 |
| 2024 | $1,060 | $152,846 | $45,427 | $107,419 |
| 2023 | $1,060 | $127,329 | $29,812 | $97,517 |
| 2022 | $1,964 | $101,923 | $22,714 | $79,209 |
| 2021 | $1,890 | $81,072 | $14,196 | $66,876 |
| 2020 | $1,957 | $81,072 | $14,196 | $66,876 |
| 2019 | $1,859 | $78,022 | $11,357 | $66,665 |
| 2018 | $1,057 | $66,804 | $11,357 | $55,447 |
| 2017 | $1,562 | $61,766 | $11,357 | $50,409 |
| 2016 | $1,161 | $45,933 | $11,357 | $34,576 |
| 2015 | $81 | $45,933 | $11,357 | $34,576 |
| 2014 | $81 | $45,933 | $11,357 | $34,576 |
Source: Public Records
Map
Nearby Homes
- 6206 Antha St
- 6226 E Tidwell Rd
- 5009 Tidwell Rd
- 6110 Tidwell Rd
- 9603 Bertwood St
- 9711 Bertwood St
- 9838 Camay Dr
- 9410 Dandy St
- 9603 Homestead Rd
- 9317 Homestead Rd
- 8504 Shady Dr
- 9227 Homestead Rd
- 5715 Rietta St
- 5713 Rietta St
- 5914 Breland St
- 9325 Grady St
- 9009 Compton St
- 9421 Sandra St
- 9205 & 9207 Spaulding St
- 9318 Sundown Dr