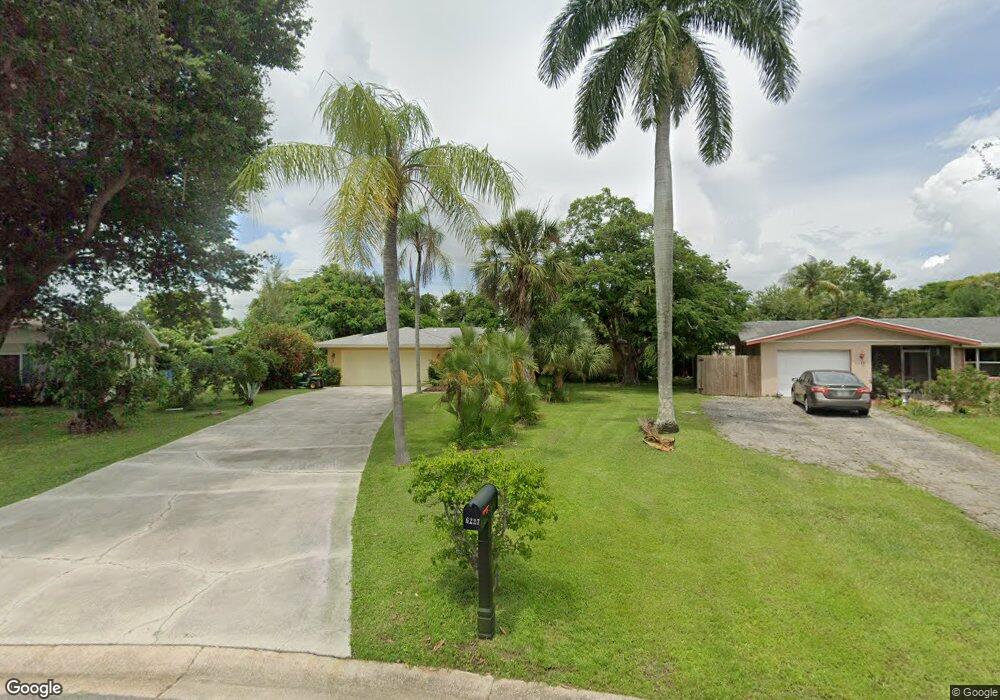
6227 Saint Andrews Cir N Fort Myers, FL 33919
Whiskey Creek NeighborhoodEstimated Value: $317,000 - $408,000
3
Beds
2
Baths
1,253
Sq Ft
$290/Sq Ft
Est. Value
About This Home
This home is located at 6227 Saint Andrews Cir N, Fort Myers, FL 33919 and is currently estimated at $362,939, approximately $289 per square foot. 6227 Saint Andrews Cir N is a home located in Lee County with nearby schools including Orangewood Elementary School, Allen Park Elementary School, and Edison Park Creative & Expressive Arts School.
Ownership History
Date
Name
Owned For
Owner Type
Purchase Details
Closed on
Jan 30, 2004
Sold by
Schwind Seven
Bought by
Lucas Megan
Current Estimated Value
Home Financials for this Owner
Home Financials are based on the most recent Mortgage that was taken out on this home.
Original Mortgage
$129,000
Outstanding Balance
$60,585
Interest Rate
5.85%
Estimated Equity
$302,354
Purchase Details
Closed on
Oct 21, 1999
Sold by
Renz Eric J and Renz Vivian A
Bought by
Renz Eric J
Purchase Details
Closed on
Mar 12, 1999
Sold by
Shpielman Wallace E
Bought by
Renz Eric J and Renz Vivian A
Home Financials for this Owner
Home Financials are based on the most recent Mortgage that was taken out on this home.
Original Mortgage
$102,600
Interest Rate
6.74%
Purchase Details
Closed on
Apr 6, 1994
Sold by
Priddy Jeffrey and Priddy Denise
Bought by
Spielman Wallace E
Home Financials for this Owner
Home Financials are based on the most recent Mortgage that was taken out on this home.
Original Mortgage
$75,600
Interest Rate
7.47%
Create a Home Valuation Report for This Property
The Home Valuation Report is an in-depth analysis detailing your home's value as well as a comparison with similar homes in the area
Home Values in the Area
Average Home Value in this Area
Purchase History
| Date | Buyer | Sale Price | Title Company |
|---|---|---|---|
| Lucas Megan | $179,000 | -- | |
| Renz Eric J | -- | -- | |
| Renz Eric J | $114,000 | -- | |
| Spielman Wallace E | $108,000 | -- |
Source: Public Records
Mortgage History
| Date | Status | Borrower | Loan Amount |
|---|---|---|---|
| Open | Lucas Megan | $129,000 | |
| Previous Owner | Renz Eric J | $102,600 | |
| Previous Owner | Spielman Wallace E | $75,600 |
Source: Public Records
Tax History Compared to Growth
Tax History
| Year | Tax Paid | Tax Assessment Tax Assessment Total Assessment is a certain percentage of the fair market value that is determined by local assessors to be the total taxable value of land and additions on the property. | Land | Improvement |
|---|---|---|---|---|
| 2025 | $1,264 | $114,417 | -- | -- |
| 2024 | $1,218 | $111,192 | -- | -- |
| 2023 | $1,218 | $107,953 | $0 | $0 |
| 2022 | $1,304 | $104,809 | $0 | $0 |
| 2021 | $1,242 | $215,224 | $50,000 | $165,224 |
| 2020 | $1,226 | $100,351 | $0 | $0 |
| 2019 | $1,196 | $98,095 | $0 | $0 |
| 2018 | $1,195 | $96,266 | $0 | $0 |
| 2017 | $1,179 | $94,286 | $0 | $0 |
| 2016 | $1,161 | $174,773 | $34,500 | $140,273 |
| 2015 | $1,168 | $136,500 | $32,000 | $104,500 |
| 2014 | -- | $117,503 | $19,000 | $98,503 |
| 2013 | -- | $109,802 | $14,000 | $95,802 |
Source: Public Records
Map
Nearby Homes
- 1420 Mandel Rd
- 1427 Davis Dr
- 1442 Byron Rd
- 1358 Hopedale Dr
- 8327 Riviera Ave
- 6011 Fountain Way
- 5034 Westminster Dr
- 1457 Byron Rd
- 8451 Casa Del Rio Ln
- 1212 Twin Palm Dr
- 19 Winewood Ct
- 6005 W Riverside Dr
- 1221 La Faunce Way
- 8297 San Marcos
- 20 Catalpa Ct
- 1250 Kasamada Dr
- 5216 Cedarbend Dr Unit 3
- 1563 Covington Cir E
- 1348 Woodmere Ln
- 5224 Cedarbend Dr Unit 4
- 6227 Saint Andrews Cir N
- 6229 Saint Andrews Cir N
- 1412 Charles Ct
- 1414 Charles Rd
- 6225 Saint Andrews Cir N
- 1410 Charles Ct
- 1416 Charles Rd
- 6231 Saint Andrews Cir N
- 1454 Argyle Dr
- 1418 Charles Rd
- 6223 Saint Andrews Cir N
- 1456 Argyle Dr
- 6224 Saint Andrews Cir N
- 6233 Saint Andrews Cir N
- 1452 Argyle Dr
- 1422 Loma Linda Dr
- 1420 Charles Rd
- 1429 Rose Ln
- 1417 Charles Rd
- 6235 Saint Andrews Cir N