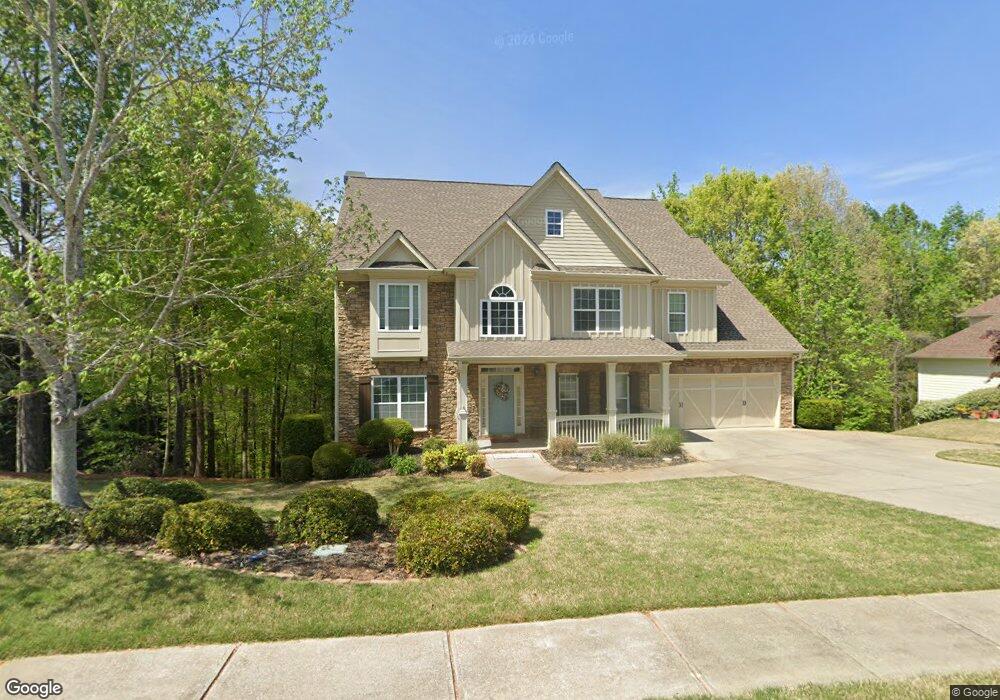
6228 Cascade Falls Dr Unit 29 Buford, GA 30518
Estimated Value: $645,000 - $881,000
4
Beds
4
Baths
2,376
Sq Ft
$307/Sq Ft
Est. Value
About This Home
This home is located at 6228 Cascade Falls Dr Unit 29, Buford, GA 30518 and is currently estimated at $729,363, approximately $306 per square foot. 6228 Cascade Falls Dr Unit 29 is a home located in Hall County with nearby schools including Friendship Elementary School, C.W. Davis Middle School, and Flowery Branch High School.
Ownership History
Date
Name
Owned For
Owner Type
Purchase Details
Closed on
Jul 12, 2016
Sold by
Bowman Brian R and Bowman Lori
Bought by
Trainor Charles E and Trainor Kathleen L
Current Estimated Value
Home Financials for this Owner
Home Financials are based on the most recent Mortgage that was taken out on this home.
Original Mortgage
$354,350
Outstanding Balance
$280,979
Interest Rate
3.54%
Estimated Equity
$448,384
Purchase Details
Closed on
Jul 19, 2013
Sold by
Bowman Brian R
Bought by
Bowman Brian R and Bowman Lori
Home Financials for this Owner
Home Financials are based on the most recent Mortgage that was taken out on this home.
Original Mortgage
$283,500
Interest Rate
3.96%
Purchase Details
Closed on
Apr 26, 2013
Sold by
Reynolds Stephen C
Bought by
Southeastern Freight Lines Inc
Purchase Details
Closed on
May 31, 2005
Sold by
Metro Construction Inc
Bought by
Reynolds Stephen C and Reynolds Sandra
Home Financials for this Owner
Home Financials are based on the most recent Mortgage that was taken out on this home.
Original Mortgage
$210,000
Interest Rate
5.74%
Mortgage Type
New Conventional
Purchase Details
Closed on
Dec 12, 2003
Sold by
R & M Developers Inc
Bought by
Metro Construction Inc
Create a Home Valuation Report for This Property
The Home Valuation Report is an in-depth analysis detailing your home's value as well as a comparison with similar homes in the area
Home Values in the Area
Average Home Value in this Area
Purchase History
| Date | Buyer | Sale Price | Title Company |
|---|---|---|---|
| Trainor Charles E | $374,000 | -- | |
| Bowman Brian R | -- | -- | |
| Bowman Brian R | $315,500 | -- | |
| Southeastern Freight Lines Inc | $315,000 | -- | |
| Reynolds Stephen C | $339,900 | -- | |
| Metro Construction Inc | $1,650,000 | -- |
Source: Public Records
Mortgage History
| Date | Status | Borrower | Loan Amount |
|---|---|---|---|
| Open | Trainor Charles E | $354,350 | |
| Previous Owner | Bowman Brian R | $283,500 | |
| Previous Owner | Reynolds Stephen C | $210,000 |
Source: Public Records
Tax History Compared to Growth
Tax History
| Year | Tax Paid | Tax Assessment Tax Assessment Total Assessment is a certain percentage of the fair market value that is determined by local assessors to be the total taxable value of land and additions on the property. | Land | Improvement |
|---|---|---|---|---|
| 2025 | $4,784 | $211,120 | $21,840 | $189,280 |
| 2024 | $5,188 | $205,320 | $21,840 | $183,480 |
| 2023 | $4,577 | $196,480 | $21,840 | $174,640 |
| 2022 | $4,483 | $169,760 | $21,840 | $147,920 |
| 2021 | $4,443 | $166,320 | $21,840 | $144,480 |
| 2020 | $4,599 | $167,360 | $21,840 | $145,520 |
| 2019 | $4,460 | $160,800 | $21,840 | $138,960 |
| 2018 | $4,441 | $154,960 | $21,840 | $133,120 |
| 2017 | $4,076 | $143,520 | $21,840 | $121,680 |
| 2016 | $4,093 | $147,680 | $21,840 | $125,840 |
| 2015 | $3,503 | $124,960 | $15,280 | $109,680 |
| 2014 | $3,503 | $124,960 | $15,280 | $109,680 |
Source: Public Records
Map
Nearby Homes
- 5832 Bay View Dr
- 5926 Mount Water Trail
- 5862 Bay View Dr
- 6228 Lanier Harbor Landing
- 6119 Bethany View Trail
- 5885 Bay View Dr
- 6205 Bridgewood Dr
- 6225 Bridgewood Dr
- 6386 Tuggle Dr
- 5775 Lakeshore Dr
- 5989 Lanier Islands Pkwy
- 5697 Frontier Walk Ln
- 5574 Lanier Islands Pkwy
- 3600 Shoreland Dr
- 2610 Buford Dam Rd
- 6558 Lanier Islands Pkwy
- 2759 S Waterworks Rd
- 6030 Chimney Springs Rd
- 3180 Lee Dr
- 2482 Windchase Ct
- 6228 Cascade Falls Dr
- 6222 Cascade Falls Dr
- 6234 Cascade Falls Dr
- 6225 Cascade Falls Dr
- 6229 Cascade Falls Dr
- 6238 Cascade Falls Dr
- 6233 Cascade Falls Dr
- 6221 Cascade Falls Dr
- 6237 Cascade Falls Dr
- 6216 Cascade Falls Dr Unit 31
- 6216 Cascade Falls Dr
- 5906 Mount Water Trail
- 6304 Old Wood Hollow Way
- 5910 Mount Water Trail
- 6210 Cascade Falls Dr
- 5914 Mount Water Trail Unit Master Room
- 5914 Mount Water Trail Unit Room 1
- 5914 Mount Water Trail Unit Room 3
- 5914 Mount Water Trail Unit Master Bedroom
- 5914 Mount Water Trail Unit Room 2