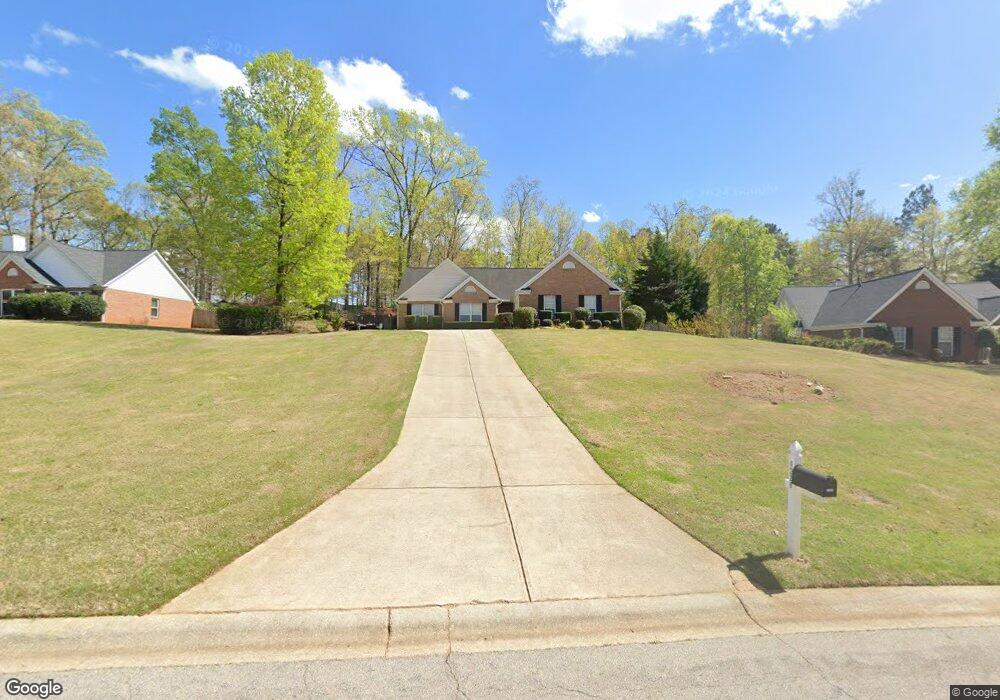
6229 Huckleberry Ridge Unit 17 Flowery Branch, GA 30542
Estimated Value: $407,826 - $535,000
3
Beds
2
Baths
1,707
Sq Ft
$262/Sq Ft
Est. Value
About This Home
This home is located at 6229 Huckleberry Ridge Unit 17, Flowery Branch, GA 30542 and is currently estimated at $447,707, approximately $262 per square foot. 6229 Huckleberry Ridge Unit 17 is a home located in Hall County with nearby schools including Flowery Branch Elementary School, West Hall Middle School, and West Hall High School.
Ownership History
Date
Name
Owned For
Owner Type
Purchase Details
Closed on
Apr 2, 2021
Sold by
Chon Ben H
Bought by
Chon Ben H and Chon Micha
Current Estimated Value
Home Financials for this Owner
Home Financials are based on the most recent Mortgage that was taken out on this home.
Original Mortgage
$201,600
Outstanding Balance
$182,020
Interest Rate
3%
Mortgage Type
New Conventional
Estimated Equity
$265,687
Purchase Details
Closed on
Apr 28, 2000
Sold by
Bowen & Bowen Construction Co
Bought by
Reynolds Marvin G and Reynolds Barbara W
Home Financials for this Owner
Home Financials are based on the most recent Mortgage that was taken out on this home.
Original Mortgage
$134,487
Interest Rate
8.28%
Mortgage Type
New Conventional
Purchase Details
Closed on
Jun 29, 1999
Sold by
Blue Ridge Development
Bought by
Bowen And Bowen Construction Co Inc
Create a Home Valuation Report for This Property
The Home Valuation Report is an in-depth analysis detailing your home's value as well as a comparison with similar homes in the area
Home Values in the Area
Average Home Value in this Area
Purchase History
| Date | Buyer | Sale Price | Title Company |
|---|---|---|---|
| Chon Ben H | -- | -- | |
| Chon Ben H | $291,500 | -- | |
| Reynolds Marvin G | $146,100 | -- | |
| Bowen And Bowen Construction Co Inc | $444,000 | -- |
Source: Public Records
Mortgage History
| Date | Status | Borrower | Loan Amount |
|---|---|---|---|
| Open | Chon Ben H | $201,600 | |
| Closed | Chon Ben H | $201,600 | |
| Previous Owner | Reynolds Marvin G | $134,487 |
Source: Public Records
Tax History Compared to Growth
Tax History
| Year | Tax Paid | Tax Assessment Tax Assessment Total Assessment is a certain percentage of the fair market value that is determined by local assessors to be the total taxable value of land and additions on the property. | Land | Improvement |
|---|---|---|---|---|
| 2024 | $4,231 | $164,200 | $26,080 | $138,120 |
| 2023 | $3,989 | $154,760 | $26,080 | $128,680 |
| 2022 | $3,140 | $115,520 | $13,800 | $101,720 |
| 2021 | $972 | $91,240 | $9,200 | $82,040 |
| 2020 | $949 | $87,000 | $9,200 | $77,800 |
| 2019 | $903 | $80,880 | $9,200 | $71,680 |
| 2018 | $836 | $71,680 | $9,200 | $62,480 |
| 2017 | $755 | $67,360 | $9,200 | $58,160 |
| 2016 | $558 | $51,156 | $7,360 | $43,796 |
| 2015 | $558 | $51,156 | $7,360 | $43,796 |
| 2014 | $558 | $51,156 | $7,360 | $43,796 |
Source: Public Records
Map
Nearby Homes
- 6229 Huckleberry Ridge
- 6225 Huckleberry Ridge
- 6233 Huckleberry Ridge
- 6237 Huckleberry Ridge
- 6221 Huckleberry Ridge
- 0 Huckleberry Ridge Unit 8772445
- 0 Huckleberry Ridge Unit 8938715
- 0 Huckleberry Ridge
- 5668 Frazer Rd
- 6241 Huckleberry Ridge
- 6226 Huckleberry Ridge
- 6217 Huckleberry Ridge
- 6222 Huckleberry Ridge
- 6245 Huckleberry Ridge
- 6234 Huckleberry Ridge
- 6218 Huckleberry Ridge
- 4226 Brentwood Dr
- 4226 Brentwood Dr Unit 12-A
- 4222 Brentwood Dr
- 4230 Brentwood Dr