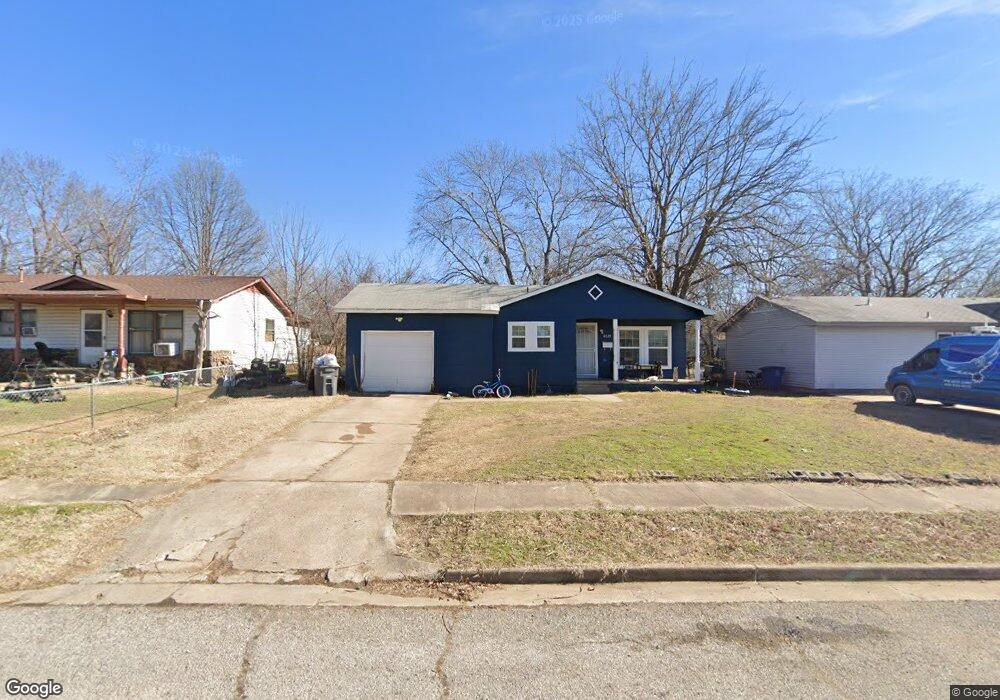
6229 N Denver Ave Tulsa, OK 74126
Turley NeighborhoodEstimated Value: $66,000 - $96,000
--
Bed
1
Bath
1,236
Sq Ft
$64/Sq Ft
Est. Value
About This Home
This home is located at 6229 N Denver Ave, Tulsa, OK 74126 and is currently estimated at $79,089, approximately $63 per square foot. 6229 N Denver Ave is a home located in Tulsa County with nearby schools including Monroe Demonstration Academy, McLain High School of Science and Technology, and Tulsa Legacy Charter School.
Ownership History
Date
Name
Owned For
Owner Type
Purchase Details
Closed on
Jun 16, 2021
Sold by
County Of Tulsa
Bought by
Duncan Derrick and Duncan Tiffani
Current Estimated Value
Purchase Details
Closed on
Mar 23, 2015
Sold by
Real Property Dynamcis Inc
Bought by
6229 Property Co
Purchase Details
Closed on
Mar 25, 2003
Sold by
Simmons Joseph D and Doe Jane
Bought by
Real Property Dynamics Inc
Purchase Details
Closed on
Nov 30, 1999
Sold by
Williams Calvin
Bought by
Simmons Joseph D
Home Financials for this Owner
Home Financials are based on the most recent Mortgage that was taken out on this home.
Original Mortgage
$34,200
Interest Rate
7.93%
Mortgage Type
Purchase Money Mortgage
Purchase Details
Closed on
Apr 1, 1999
Sold by
Williams Calvin E
Bought by
Simmons Joseph D
Home Financials for this Owner
Home Financials are based on the most recent Mortgage that was taken out on this home.
Original Mortgage
$35,500
Interest Rate
7.73%
Mortgage Type
Seller Take Back
Create a Home Valuation Report for This Property
The Home Valuation Report is an in-depth analysis detailing your home's value as well as a comparison with similar homes in the area
Home Values in the Area
Average Home Value in this Area
Purchase History
| Date | Buyer | Sale Price | Title Company |
|---|---|---|---|
| Duncan Derrick | $20,000 | None Available | |
| 6229 Property Co | -- | None Available | |
| Real Property Dynamics Inc | -- | -- | |
| Simmons Joseph D | $34,500 | Midwest Title Service | |
| Simmons Joseph D | $35,500 | -- |
Source: Public Records
Mortgage History
| Date | Status | Borrower | Loan Amount |
|---|---|---|---|
| Previous Owner | Simmons Joseph D | $34,200 | |
| Previous Owner | Simmons Joseph D | $35,500 |
Source: Public Records
Tax History Compared to Growth
Tax History
| Year | Tax Paid | Tax Assessment Tax Assessment Total Assessment is a certain percentage of the fair market value that is determined by local assessors to be the total taxable value of land and additions on the property. | Land | Improvement |
|---|---|---|---|---|
| 2024 | $300 | $2,486 | $597 | $1,889 |
| 2023 | $300 | $2,367 | $682 | $1,685 |
| 2022 | $301 | $2,255 | $715 | $1,540 |
| 2021 | $312 | $2,365 | $715 | $1,650 |
| 2020 | $308 | $2,365 | $715 | $1,650 |
| 2019 | $324 | $2,365 | $715 | $1,650 |
| 2018 | $325 | $2,365 | $715 | $1,650 |
| 2017 | $324 | $2,365 | $715 | $1,650 |
| 2016 | $317 | $2,365 | $715 | $1,650 |
| 2015 | $318 | $2,365 | $715 | $1,650 |
| 2014 | $315 | $2,365 | $715 | $1,650 |
Source: Public Records
Map
Nearby Homes
- 0 W 63rd St N Unit 2521119
- 6365 N Denver Ave
- 6371 N Main St
- 508 E 58th St N
- 5608 N Garrison Ave
- 557 E 59th St N
- 5703 N Garrison Place
- 5439 N Frankfort Ave
- 536 E 55th St N
- 414 E 54th St N
- 7487 N Oakcliff Dr
- 223 E 52nd St N
- 5464 N Hartford Place
- 2019 W 53rd St N
- 713 E 54th Place N
- 6418 N Norfolk Ave
- 3 W 50th Place N
- 120 W 50th Place N
- 729 E 54th St N
- 519 E 51st Place N
- 6225 N Denver Ave
- 6235 N Denver Ave
- 6221 N Denver Ave
- 6239 N Denver Ave
- 6242 N Cheyenne Ave
- 305 W 62nd Place N
- 6232 N Cheyenne Ave
- 204 W 63rd St N
- 6228 N Cheyenne Ave
- 306 W 63rd St N
- 6215 N Denver Ave
- 311 W 62nd Place N
- 306 W 62nd Place N
- 6224 N Cheyenne Ave
- 312 W 63rd St N
- 6211 N Denver Ave
- 312 W 62nd Place N
- 315 W 62nd Place N
- 6304 N Denver Ave
- 309 W 63rd St N