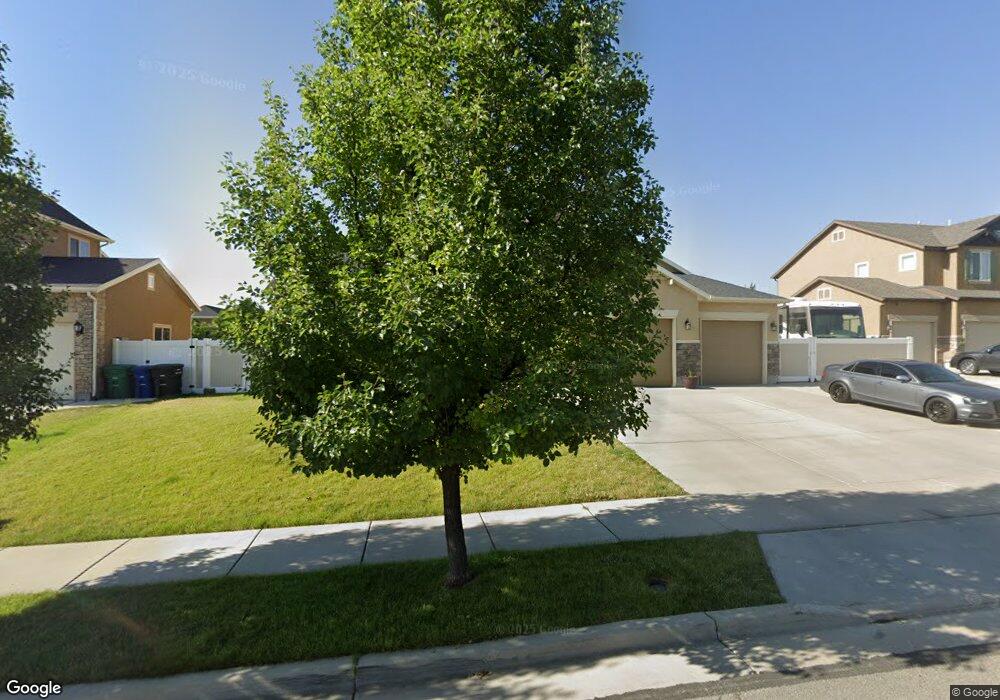
6229 W Dinsmore Way West Jordan, UT 84081
Jordan Hills NeighborhoodEstimated Value: $632,000 - $672,736
4
Beds
2
Baths
3,171
Sq Ft
$206/Sq Ft
Est. Value
About This Home
This home is located at 6229 W Dinsmore Way, West Jordan, UT 84081 and is currently estimated at $651,934, approximately $205 per square foot. 6229 W Dinsmore Way is a home located in Salt Lake County with nearby schools including Fox Hollow School, Sunset Ridge Middle School, and Copper Hills High School.
Ownership History
Date
Name
Owned For
Owner Type
Purchase Details
Closed on
Jun 30, 2020
Sold by
Fazio Christopher L
Bought by
Fazio Christopher L and Fazio Gina M
Current Estimated Value
Home Financials for this Owner
Home Financials are based on the most recent Mortgage that was taken out on this home.
Original Mortgage
$287,940
Outstanding Balance
$255,800
Interest Rate
3.2%
Mortgage Type
New Conventional
Estimated Equity
$396,134
Purchase Details
Closed on
Feb 26, 2016
Sold by
Lund Dewey Dearen and Lund Chelsea Jean
Bought by
Mcmillan Gary D and Lundin Deanna M
Home Financials for this Owner
Home Financials are based on the most recent Mortgage that was taken out on this home.
Original Mortgage
$321,300
Interest Rate
3.92%
Mortgage Type
New Conventional
Purchase Details
Closed on
Jun 20, 2014
Sold by
Woodside Riverwalk Preserve Llc
Bought by
Lund Dewey Dearen and Lund Chelsea Jean
Home Financials for this Owner
Home Financials are based on the most recent Mortgage that was taken out on this home.
Original Mortgage
$297,413
Interest Rate
3.37%
Mortgage Type
FHA
Create a Home Valuation Report for This Property
The Home Valuation Report is an in-depth analysis detailing your home's value as well as a comparison with similar homes in the area
Home Values in the Area
Average Home Value in this Area
Purchase History
| Date | Buyer | Sale Price | Title Company |
|---|---|---|---|
| Fazio Christopher L | -- | Artisan Title | |
| Fazio Christopher L | -- | Metro National Title | |
| Mcmillan Gary D | -- | Premium Title & Escrow | |
| Lund Dewey Dearen | -- | Us Title |
Source: Public Records
Mortgage History
| Date | Status | Borrower | Loan Amount |
|---|---|---|---|
| Open | Fazio Christopher L | $287,940 | |
| Previous Owner | Mcmillan Gary D | $321,300 | |
| Previous Owner | Lund Dewey Dearen | $297,413 |
Source: Public Records
Tax History Compared to Growth
Tax History
| Year | Tax Paid | Tax Assessment Tax Assessment Total Assessment is a certain percentage of the fair market value that is determined by local assessors to be the total taxable value of land and additions on the property. | Land | Improvement |
|---|---|---|---|---|
| 2025 | $3,205 | $634,500 | $176,500 | $458,000 |
| 2024 | $3,205 | $616,600 | $171,400 | $445,200 |
| 2023 | $3,254 | $590,100 | $164,800 | $425,300 |
| 2022 | $3,378 | $602,600 | $161,600 | $441,000 |
| 2021 | $2,839 | $461,100 | $127,300 | $333,800 |
| 2020 | $2,670 | $406,900 | $127,300 | $279,600 |
| 2019 | $2,680 | $400,500 | $127,300 | $273,200 |
| 2018 | $2,551 | $378,100 | $125,200 | $252,900 |
| 2017 | $2,414 | $356,300 | $125,200 | $231,100 |
| 2016 | $2,353 | $416,500 | $122,200 | $294,300 |
| 2015 | $3,036 | $410,400 | $124,500 | $285,900 |
| 2014 | $970 | $71,000 | $71,000 | $0 |
Source: Public Records
Map
Nearby Homes
- 8368 S Oak Gate Dr
- Creighton Farmhouse Plan at Dry Creek Highlands - Signature
- 8687 S Rock Lake Ct
- 6568 W Raynolds Peak Way
- Vancouver Plan at Dry Creek Highlands - Towns
- Bellevue 2 Plan at Dry Creek Highlands - Towns
- Carson Plan at Dry Creek Highlands - Cottages
- 6566 W Raynolds Peak Way
- 6588 W Raynolds Peak Way
- 6567 W Bannon St
- 6592 W Raynolds Peak Way
- 8457 S 6430 W
- 8497 S 6465 W
- Larsen Plan at Copperhaven by Toll Brothers
- Brooke Plan at Copperhaven by Toll Brothers
- 8501 S Michele River Ave Unit 116
- 8356 S Four Elm Cir
- 5958 W Eric Mountain Ln
- 5958 W Eric Mountain Ln Unit 104
- 5946 W Eric Mountain Ln Unit 103
- 6213 W Dinsmore Way
- 6239 W Dinsmore Way Unit 510
- 8557 S Dahill Ln
- 7594 Opal Mountain Way
- 6201 W Dinsmore Way
- 6212 W Dinsmore Way
- 6251 W Dinsmore Way Unit 511
- 8616 S Duck Ridge Way
- 8562 S Dahill Ln
- 8617 S Duck Ridge Way Unit 632
- 8541 S Dahill Ln Unit 529
- 8548 S Dahill Ln Unit 513
- 6194 W Dinsmore Way
- 6187 W Dinsmore Way
- 6211 W Dahill Ln Unit 528
- 8632 S Duck Ridge Way
- 8536 S Dahill Ln
- 8629 S Duck Ridge Way Unit 631
- 6182 W Dinsmore Way
- 6173 W Dinsmore Way