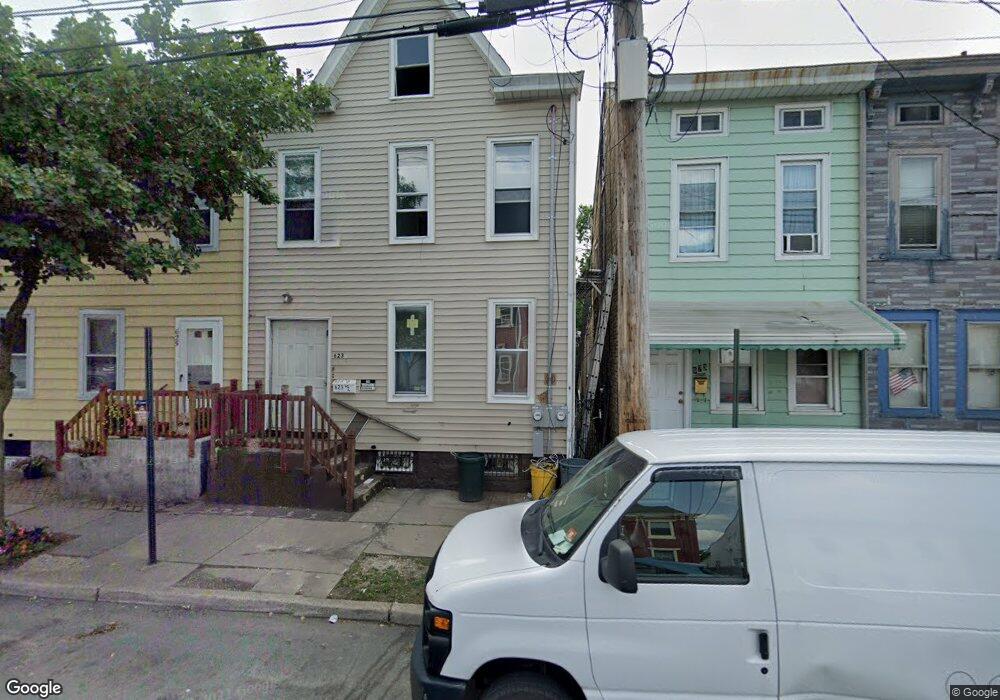
623 1/2 2nd St Trenton, NJ 08611
South Trenton NeighborhoodEstimated Value: $214,752 - $271,000
--
Bed
--
Bath
1,474
Sq Ft
$167/Sq Ft
Est. Value
About This Home
This home is located at 623 1/2 2nd St, Trenton, NJ 08611 and is currently estimated at $246,688, approximately $167 per square foot. 623 1/2 2nd St is a home located in Mercer County with nearby schools including Mott Elementary School, Parker Elementary School, and Grace A Dunn Middle School.
Ownership History
Date
Name
Owned For
Owner Type
Purchase Details
Closed on
Jun 12, 2019
Sold by
Jersey Premium Rentals Llc
Bought by
Sunjpark Rentals Llc
Current Estimated Value
Home Financials for this Owner
Home Financials are based on the most recent Mortgage that was taken out on this home.
Original Mortgage
$82,000
Outstanding Balance
$71,952
Interest Rate
4%
Mortgage Type
Construction
Estimated Equity
$174,736
Purchase Details
Closed on
Apr 29, 2019
Sold by
Us Bank National Assocation
Bought by
Jersey Premiun Rentals Llc
Home Financials for this Owner
Home Financials are based on the most recent Mortgage that was taken out on this home.
Original Mortgage
$82,000
Outstanding Balance
$71,952
Interest Rate
4%
Mortgage Type
Construction
Estimated Equity
$174,736
Purchase Details
Closed on
Jan 7, 2019
Sold by
Nationstar Mortgage Llc
Bought by
U S Bank National Association
Create a Home Valuation Report for This Property
The Home Valuation Report is an in-depth analysis detailing your home's value as well as a comparison with similar homes in the area
Home Values in the Area
Average Home Value in this Area
Purchase History
| Date | Buyer | Sale Price | Title Company |
|---|---|---|---|
| Sunjpark Rentals Llc | -- | River Edge Fitle Agency Llc | |
| Jersey Premiun Rentals Llc | $58,200 | River Edge Title Agency | |
| U S Bank National Association | -- | None Available |
Source: Public Records
Mortgage History
| Date | Status | Borrower | Loan Amount |
|---|---|---|---|
| Open | Sunjpark Rentals Llc | $82,000 |
Source: Public Records
Tax History Compared to Growth
Tax History
| Year | Tax Paid | Tax Assessment Tax Assessment Total Assessment is a certain percentage of the fair market value that is determined by local assessors to be the total taxable value of land and additions on the property. | Land | Improvement |
|---|---|---|---|---|
| 2025 | $5,233 | $90,200 | $8,400 | $81,800 |
| 2024 | $5,021 | $90,200 | $8,400 | $81,800 |
| 2023 | $5,021 | $90,200 | $8,400 | $81,800 |
| 2022 | $4,923 | $90,200 | $8,400 | $81,800 |
| 2021 | $3,565 | $90,200 | $8,400 | $81,800 |
| 2020 | $4,993 | $64,200 | $8,400 | $55,800 |
| 2019 | $3,496 | $64,200 | $8,400 | $55,800 |
| 2018 | $3,347 | $64,200 | $8,400 | $55,800 |
| 2017 | $3,181 | $64,200 | $8,400 | $55,800 |
| 2016 | $3,216 | $55,900 | $13,400 | $42,500 |
| 2015 | $3,205 | $55,900 | $13,400 | $42,500 |
| 2014 | $3,190 | $55,900 | $13,400 | $42,500 |
Source: Public Records
Map
Nearby Homes