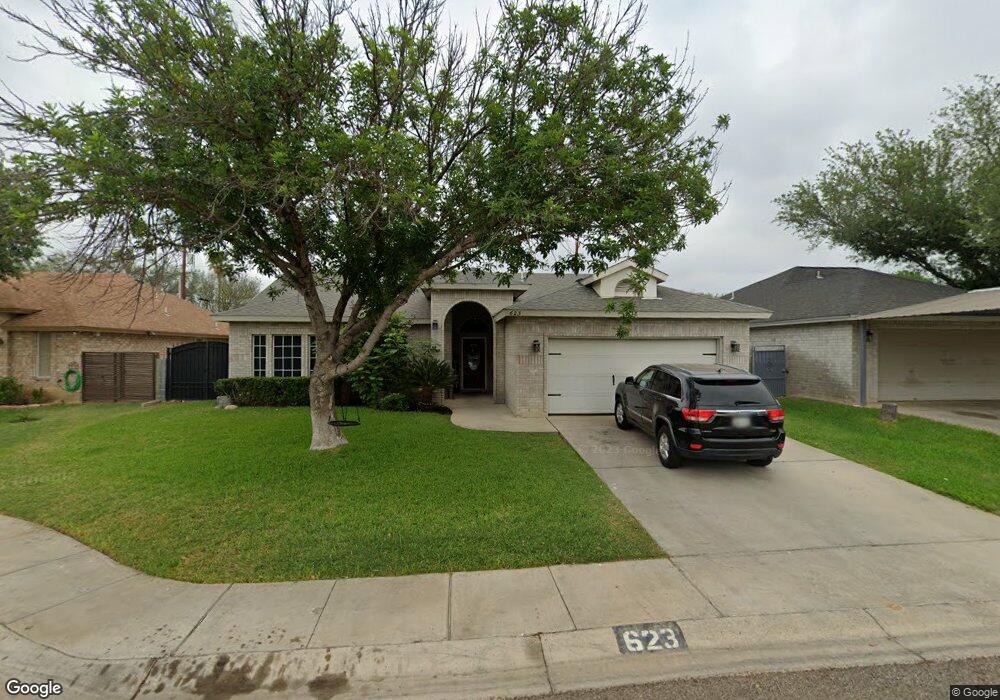
623 Anfield Loop Laredo, TX 78045
Estimated Value: $278,396 - $313,000
Studio
--
Bath
1,732
Sq Ft
$169/Sq Ft
Est. Value
About This Home
This home is located at 623 Anfield Loop, Laredo, TX 78045 and is currently estimated at $292,599, approximately $168 per square foot. 623 Anfield Loop is a home located in Webb County with nearby schools including Trautmann Elementary School, Trautmann Middle School, and John B. Alexander High School.
Ownership History
Date
Name
Owned For
Owner Type
Purchase Details
Closed on
Apr 15, 2016
Sold by
Holmes Dan M and Holmes Lindsie
Bought by
Martinez Juan A and Martinez Maria Villarreal
Current Estimated Value
Home Financials for this Owner
Home Financials are based on the most recent Mortgage that was taken out on this home.
Original Mortgage
$191,105
Outstanding Balance
$151,409
Interest Rate
3.68%
Mortgage Type
VA
Estimated Equity
$141,190
Purchase Details
Closed on
Nov 17, 2005
Sold by
Cendant Mobility Relocation Company
Bought by
Veliz Pedro and Veliz Ana G
Home Financials for this Owner
Home Financials are based on the most recent Mortgage that was taken out on this home.
Original Mortgage
$139,410
Interest Rate
6.04%
Mortgage Type
Construction
Purchase Details
Closed on
Jul 20, 2005
Sold by
Lowery Teresa L
Bought by
Cendant Mobility Relocation Company
Create a Home Valuation Report for This Property
The Home Valuation Report is an in-depth analysis detailing your home's value as well as a comparison with similar homes in the area
Purchase History
| Date | Buyer | Sale Price | Title Company |
|---|---|---|---|
| Martinez Juan A | -- | Attorney | |
| Veliz Pedro | -- | Closing Title Company | |
| Cendant Mobility Relocation Company | -- | Closing Title Company |
Source: Public Records
Mortgage History
| Date | Status | Borrower | Loan Amount |
|---|---|---|---|
| Open | Martinez Juan A | $191,105 | |
| Previous Owner | Veliz Pedro | $139,410 |
Source: Public Records
Tax History
| Year | Tax Paid | Tax Assessment Tax Assessment Total Assessment is a certain percentage of the fair market value that is determined by local assessors to be the total taxable value of land and additions on the property. | Land | Improvement |
|---|---|---|---|---|
| 2025 | $1,307 | $281,565 | $82,970 | $198,595 |
| 2024 | $1,307 | $257,440 | $82,970 | $174,470 |
| 2023 | $4,442 | $223,813 | $77,862 | $145,951 |
| 2022 | $4,674 | $205,867 | $66,183 | $139,684 |
| 2021 | $4,853 | $188,813 | $50,219 | $138,594 |
| 2020 | $4,496 | $174,710 | $50,220 | $124,490 |
| 2019 | $4,624 | $176,180 | $50,220 | $125,960 |
| 2018 | $4,917 | $184,860 | $51,150 | $133,710 |
| 2017 | $4,653 | $177,640 | $51,150 | $126,490 |
| 2016 | $4,250 | $162,230 | $43,670 | $118,560 |
Source: Public Records
Map
Nearby Homes
- 622 Forest Loop
- 601 Marsh Ln
- 136 North Ave
- 129 North Ave
- 308 Exeter Dr
- 8710 Gentlewind Ct
- 301 International Blvd Unit G-13
- 301 International Blvd Unit B-23
- 301 International Blvd Unit C-19
- 301 International Blvd Unit H-3
- 301 International Blvd Unit H-5
- 301 International Blvd Unit A-14
- 110 Lagos Ave
- 402 Saint Croix Dr
- 323 Farrell Rd
- 317 Farrell Rd
- 8 Fenwick Dr
- 805 Sandy Ln
- 420 E Del Mar Blvd
- 721 Lindenwood Dr
- 625 Anfield Loop
- 624 Anfield Loop
- 621 Anfield Loop
- 627 Anfield Loop
- 202 Amador Salinas Dr
- 620 Anfield Loop
- 202 North Ave
- 626 Anfield Loop
- 618 Anfield Loop
- 204 Amador Salinas Dr
- 628 Anfield Loop
- 616 Anfield Loop
- 200 North Ave
- 613 Forest Loop
- 615 Forest Loop
- 517 Manchester Loop
- 611 Forest Loop
- 617 Forest Loop
- 605 Anfield Loop
- 614 Anfield Loop
Your Personal Tour Guide
Ask me questions while you tour the home.