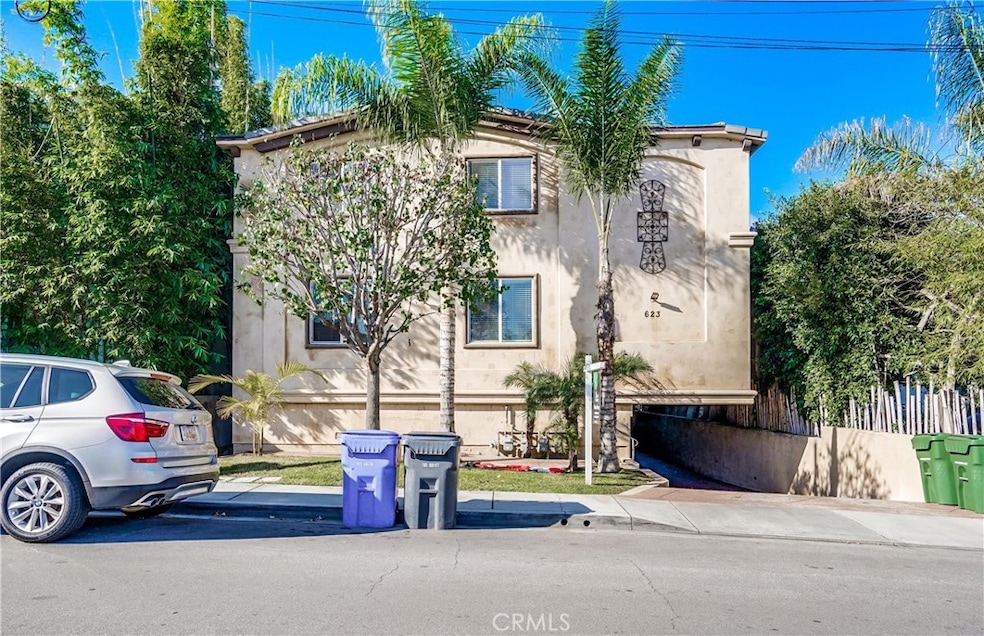
623 Aviation Way Unit C Manhattan Beach, CA 90266
Highlights
- Granite Countertops
- No HOA
- Family Room Off Kitchen
- Aurelia Pennekamp Elementary School Rated A
- 2 Car Direct Access Garage
- 3-minute walk to Mathews Parkette
About This Home
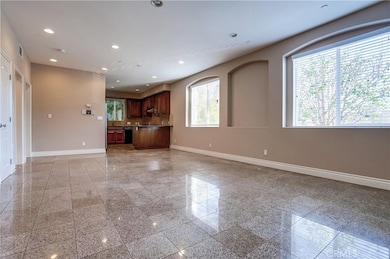
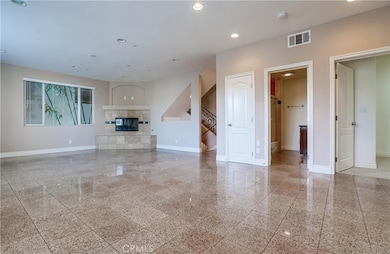
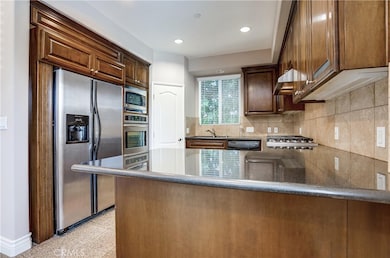
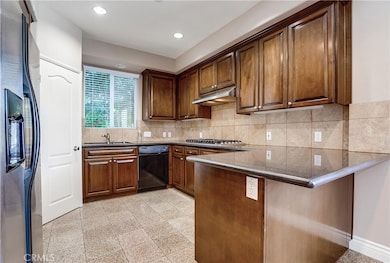
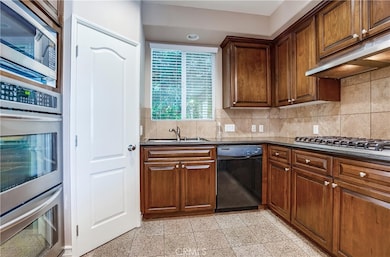
Manhattan Beach Address at Redondo Beach Lease Rates. Constructed in 2006, this interior unit townhome has polished stone floors, granite countertops, custom cabinetry, and stainless steel appliances. This remarkable abode boasts four spacious bedrooms, with one thoughtfully positioned on the first level to cater to the comfort of guests. On the second level, three additional bedrooms and two full bathrooms await, offering privacy and convenience to the home's occupants. The master bedroom boasts a walk-in closet, providing ample storage for one's personal belongings. The master bath contains a luxurious spa tub as well as a shower with dual showerheads. Fireplaces are decorative only. Completing this remarkable residence is a two-car attached garage with overhead storage, ensuring both convenience and security for your vehicles. This unit has recently received updates over the past few years, including a new countertop in the kitchen, new paint, and new carpet. Moreover, the property has been professionally cleaned, ensuring a pristine living environment for its fortunate occupants. The property is located on a quiet cul-de-sac in eastern Manhattan Beach and benefits from Manhattan Beach's esteemed school district.
Listing Agent
Rohera Capital Brokerage Phone: 310-567-9142 License #01998388 Listed on: 11/03/2025
Townhouse Details
Home Type
- Townhome
Est. Annual Taxes
- $9,633
Year Built
- Built in 2006
Lot Details
- 7,503 Sq Ft Lot
- Two or More Common Walls
Parking
- 2 Car Direct Access Garage
- Attached Carport
- Parking Available
Home Design
- Entry on the 1st floor
Interior Spaces
- 2,020 Sq Ft Home
- 3-Story Property
- Family Room with Fireplace
- Family Room Off Kitchen
- Living Room
Kitchen
- Breakfast Bar
- Electric Oven
- Gas Range
- Microwave
- Dishwasher
- Granite Countertops
Bedrooms and Bathrooms
- 4 Bedrooms | 1 Main Level Bedroom
- Walk-In Closet
- 3 Full Bathrooms
Laundry
- Laundry Room
- Washer and Gas Dryer Hookup
Utilities
- Central Heating
- No Utilities
Listing and Financial Details
- Security Deposit $5,500
- Rent includes gardener
- 12-Month Minimum Lease Term
- Available 11/3/25
- Tax Lot 1
- Tax Tract Number 6174
- Assessor Parcel Number 4163007045
Community Details
Overview
- No Home Owners Association
- 4 Units
Pet Policy
- Call for details about the types of pets allowed
- Pet Deposit $1,000
Map
Source: California Regional Multiple Listing Service (CRMLS)
MLS Number: SB25252715
APN: 4163-007-046
Disclaimer: Certain information contained herein is derived from information provided by parties other than Homes.com. All information provided is deemed reliable, but is not guaranteed to be accurate and should be independently verified.
![]() The multiple listing data appearing on this website, or contained in reports produced therefrom, is owned and copyrighted by California Regional Multiple Listing Service, Inc. ("CRMLS") and is protected by all applicable copyright laws. Information provided is for viewer's personal, non-commercial use and may not be used for any purpose other than to identify prospective properties the viewer may be interested in purchasing. All listing data, including but not limited to square footage and lot size is believed to be accurate, but the listing Agent, listing Broker and CRMLS and its affiliates do not warrant or guarantee such accuracy. The viewer should independently verify the listed data prior to making any decisions based on such information by personal inspection and/or contacting a real estate professional.
The multiple listing data appearing on this website, or contained in reports produced therefrom, is owned and copyrighted by California Regional Multiple Listing Service, Inc. ("CRMLS") and is protected by all applicable copyright laws. Information provided is for viewer's personal, non-commercial use and may not be used for any purpose other than to identify prospective properties the viewer may be interested in purchasing. All listing data, including but not limited to square footage and lot size is believed to be accurate, but the listing Agent, listing Broker and CRMLS and its affiliates do not warrant or guarantee such accuracy. The viewer should independently verify the listed data prior to making any decisions based on such information by personal inspection and/or contacting a real estate professional.
Based on information from California Regional Multiple Listing Service, Inc. and /or other sources. All data, including all measurements and calculations of area, is obtained from various sources and has not been, and will not be, verified by broker or MLS. All information should be independently reviewed and verified for accuracy. Properties may or may not be listed by the office/agent presenting the information
- 615 Aviation Way
- 1756 Ruhland Ave
- 1740 Ruhland Ave
- 1900 Vanderbilt Ln
- 2406 Aviation Blvd Unit C
- 2005 Mathews Ave Unit C
- 2001 Artesia Blvd Unit 207
- 1752 Carver St
- 1717 Axenty Way
- 308 S Redondo Ave
- 1711 Axenty Way
- 207 S Aviation Blvd
- 2508 Aviation Blvd
- 1902 Gates Ave
- 1832 Rockefeller Ln Unit 9
- 2002 Carnegie Ln Unit A
- 1722 Rockefeller Ln
- 1752 Dixon St
- 2021 Carnegie Ln Unit 7
- 1623 Carver St
- 1802 Vanderbilt Ln Unit A
- 1928 Ruhland Ave Unit A
- 1801 Aviation Way
- 1643 Artesia Blvd
- 1919 Voorhees Ave
- 1806 Carnegie Ln Unit B
- 1906 Carnegie Ln Unit A
- 1714 Wollacott St
- 1800 Green Ln
- 2013 Vanderbilt Ln Unit B
- 2009 Carnegie Ln Unit 8
- 1919 Grant Ave Unit A
- 2011 Rockefeller Ln Unit Front
- 1917 Grant Ave
- 2111 Nelson Ave
- 2109 Vanderbilt Ln Unit A
- 2700 Aviation Blvd
- 2115 Mathews Ave
- 2507 Blossom Ln
- 2119 Vanderbilt Ln
