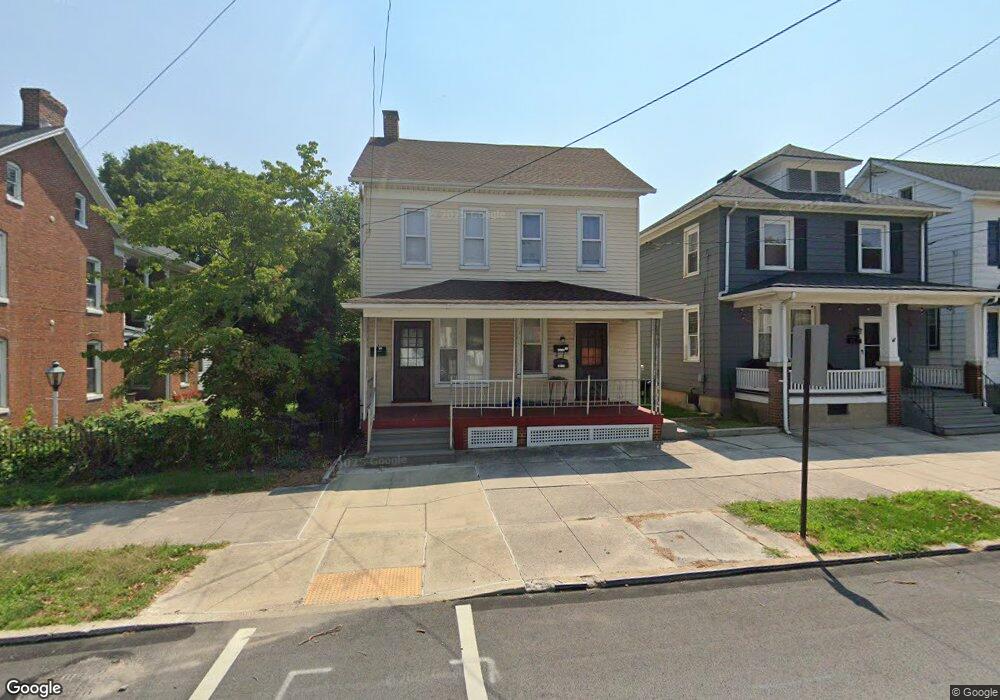
623 Broadway Hanover, PA 17331
Hanover Historic District NeighborhoodEstimated Value: $204,000 - $282,000
3
Beds
3
Baths
2,224
Sq Ft
$109/Sq Ft
Est. Value
About This Home
This home is located at 623 Broadway, Hanover, PA 17331 and is currently estimated at $242,595, approximately $109 per square foot. 623 Broadway is a home located in York County with nearby schools including Washington Elementary School, Hanover Middle School, and Hanover Senior High School.
Ownership History
Date
Name
Owned For
Owner Type
Purchase Details
Closed on
Jul 27, 2005
Sold by
Bange Jason N
Bought by
Jones Ronald L and Jones Melinda C
Current Estimated Value
Home Financials for this Owner
Home Financials are based on the most recent Mortgage that was taken out on this home.
Original Mortgage
$13,800
Interest Rate
5.2%
Mortgage Type
Fannie Mae Freddie Mac
Purchase Details
Closed on
Oct 17, 2003
Sold by
Ruby Franklin A
Bought by
Bange Jason N
Create a Home Valuation Report for This Property
The Home Valuation Report is an in-depth analysis detailing your home's value as well as a comparison with similar homes in the area
Home Values in the Area
Average Home Value in this Area
Purchase History
| Date | Buyer | Sale Price | Title Company |
|---|---|---|---|
| Jones Ronald L | $138,600 | -- | |
| Bange Jason N | $109,900 | -- |
Source: Public Records
Mortgage History
| Date | Status | Borrower | Loan Amount |
|---|---|---|---|
| Closed | Jones Ronald L | $13,800 | |
| Open | Jones Ronald L | $110,800 |
Source: Public Records
Tax History Compared to Growth
Tax History
| Year | Tax Paid | Tax Assessment Tax Assessment Total Assessment is a certain percentage of the fair market value that is determined by local assessors to be the total taxable value of land and additions on the property. | Land | Improvement |
|---|---|---|---|---|
| 2025 | $3,992 | $109,030 | $23,520 | $85,510 |
| 2024 | $3,961 | $109,030 | $23,520 | $85,510 |
| 2023 | $3,931 | $109,030 | $23,520 | $85,510 |
| 2022 | $3,883 | $109,030 | $23,520 | $85,510 |
| 2021 | $3,774 | $109,030 | $23,520 | $85,510 |
| 2020 | $3,774 | $109,030 | $23,520 | $85,510 |
| 2019 | $3,715 | $109,030 | $23,520 | $85,510 |
| 2018 | $3,646 | $109,030 | $23,520 | $85,510 |
| 2017 | $3,577 | $109,030 | $23,520 | $85,510 |
| 2016 | $0 | $109,030 | $23,520 | $85,510 |
| 2015 | -- | $109,030 | $23,520 | $85,510 |
| 2014 | -- | $109,030 | $23,520 | $85,510 |
Source: Public Records
Map
Nearby Homes