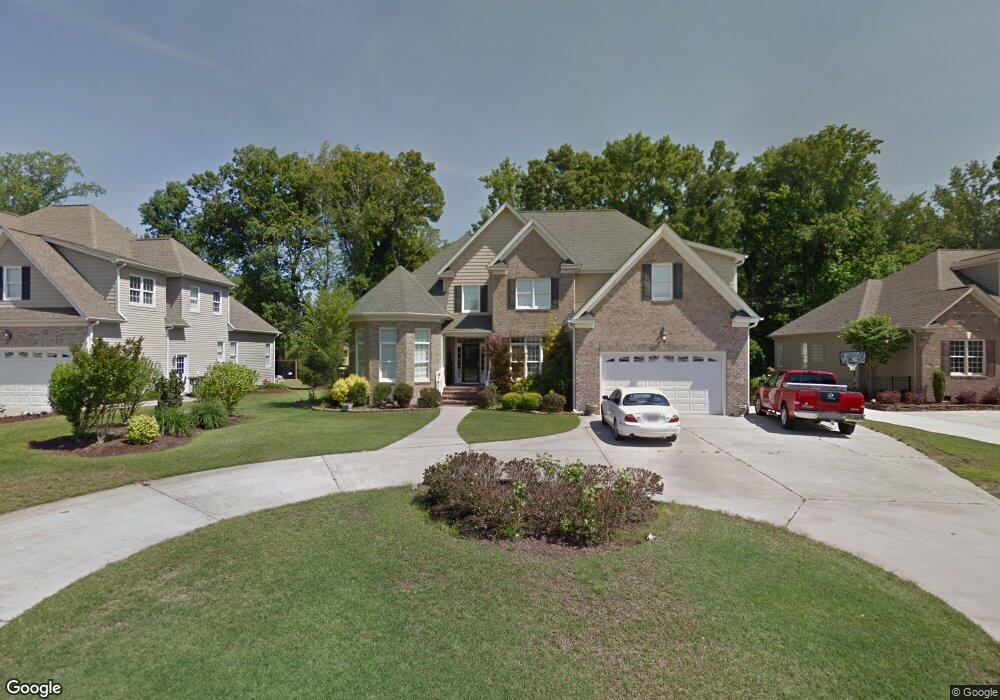
623 Cedar Ridge Dr Winterville, NC 28590
Estimated Value: $480,000 - $515,000
4
Beds
5
Baths
3,102
Sq Ft
$161/Sq Ft
Est. Value
About This Home
This home is located at 623 Cedar Ridge Dr, Winterville, NC 28590 and is currently estimated at $498,244, approximately $160 per square foot. 623 Cedar Ridge Dr is a home located in Pitt County with nearby schools including Wintergreen Primary School, Wintergreen Intermediate School, and Hope Middle School.
Ownership History
Date
Name
Owned For
Owner Type
Purchase Details
Closed on
May 6, 2025
Sold by
Thompson Donald A and Thompson Shirley E
Bought by
Donald Andronicus Thompson Revocable Living T and Shirley E Clayborne Thompson Revocable Living
Current Estimated Value
Purchase Details
Closed on
May 23, 2005
Sold by
Cherry Construction Co Inc
Bought by
Thompson Donald H and Thompson Shirley E
Home Financials for this Owner
Home Financials are based on the most recent Mortgage that was taken out on this home.
Original Mortgage
$275,200
Interest Rate
6.5%
Mortgage Type
Adjustable Rate Mortgage/ARM
Create a Home Valuation Report for This Property
The Home Valuation Report is an in-depth analysis detailing your home's value as well as a comparison with similar homes in the area
Home Values in the Area
Average Home Value in this Area
Purchase History
| Date | Buyer | Sale Price | Title Company |
|---|---|---|---|
| Donald Andronicus Thompson Revocable Living T | -- | None Listed On Document | |
| Donald Andronicus Thompson Revocable Living T | -- | None Listed On Document | |
| Thompson Donald H | $344,000 | None Available |
Source: Public Records
Mortgage History
| Date | Status | Borrower | Loan Amount |
|---|---|---|---|
| Previous Owner | Thompson Donald H | $275,200 | |
| Previous Owner | Thompson Donald H | $0 |
Source: Public Records
Tax History Compared to Growth
Tax History
| Year | Tax Paid | Tax Assessment Tax Assessment Total Assessment is a certain percentage of the fair market value that is determined by local assessors to be the total taxable value of land and additions on the property. | Land | Improvement |
|---|---|---|---|---|
| 2025 | $3,104 | $472,980 | $50,000 | $422,980 |
| 2024 | $3,092 | $472,980 | $50,000 | $422,980 |
| 2023 | $2,574 | $331,687 | $34,000 | $297,687 |
| 2022 | $2,586 | $331,687 | $34,000 | $297,687 |
| 2021 | $2,574 | $331,687 | $34,000 | $297,687 |
| 2020 | $2,591 | $331,687 | $34,000 | $297,687 |
| 2019 | $2,639 | $330,081 | $34,000 | $296,081 |
| 2018 | $2,520 | $330,081 | $34,000 | $296,081 |
| 2017 | $2,520 | $330,081 | $34,000 | $296,081 |
| 2016 | $2,411 | $330,081 | $34,000 | $296,081 |
| 2015 | $2,411 | $322,258 | $38,000 | $284,258 |
| 2014 | $2,411 | $322,258 | $38,000 | $284,258 |
Source: Public Records
Map
Nearby Homes
- 2243 Black Horse Ln
- 2203 Franklin Dr
- 133 Blackwater Dr
- 4695 Old Tar Rd
- 874 Corbett St
- 4211 Old Tar Rd
- 2136 Winder Dr
- 2061 Cornerstone Dr
- 422 Hidden Branches Close
- 102 Sunshine Ln Unit D
- 731 Winterfield Dr
- 2000 Cornerstone Dr
- 763 Winterfield Dr
- 561 Channel Dr
- 626 Winterfield Dr
- 959 van Gert Dr
- 1222 Ash Cir
- 115 Sunshine Ln Unit C
- 4222 Dudleys Grant Dr Unit B
- 2335 Wedgewood Dr
- 619 Cedar Ridge Dr
- 631 Cedar Ridge Dr
- 639 Cedar Ridge Dr
- 611 Cedar Ridge Dr
- 618 Cedar Ridge Dr
- 626 Cedar Ridge Dr
- 647 Cedar Ridge Dr
- 603 Cedar Ridge Dr
- 642 Cedar Ridge Dr
- 2114 Star Ln
- 2117 Jubilee Ln
- 657 Cedar Ridge Dr
- 2108 Jubilee Ln
- 595 Cedar Ridge Dr
- 650 Cedar Ridge Dr
- 2120 N Star Ln
- 2120 N North Star Ln
- 2123 Jubilee Ln
- 2121 N Star Ln
- 588 Cedar Ridge Dr