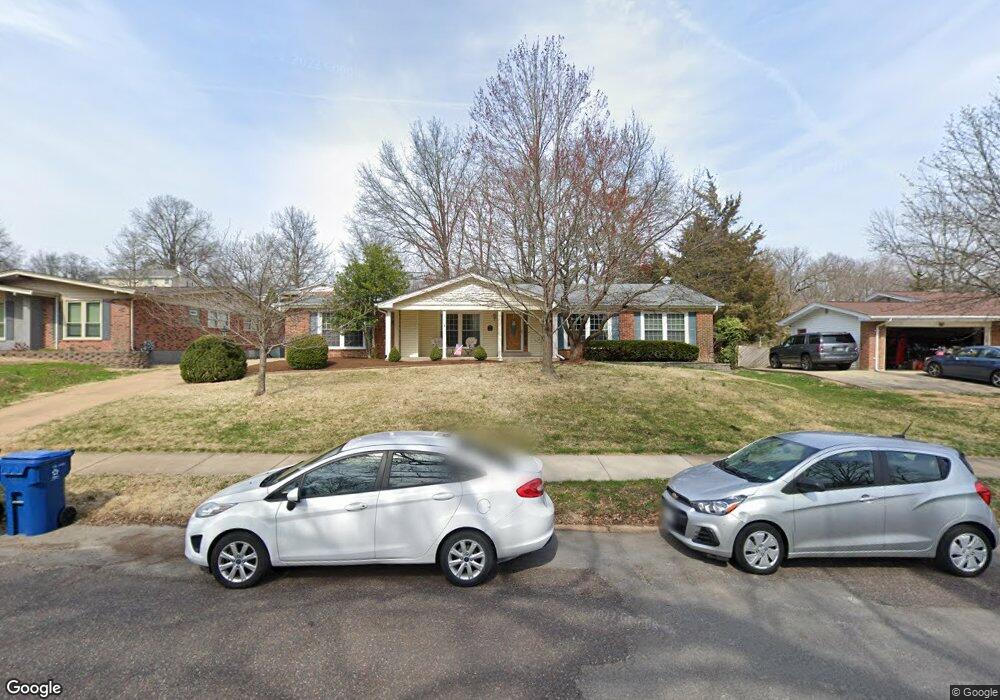
623 Claymont Dr Ballwin, MO 63011
Estimated Value: $389,768 - $440,000
3
Beds
2
Baths
1,774
Sq Ft
$233/Sq Ft
Est. Value
About This Home
This home is located at 623 Claymont Dr, Ballwin, MO 63011 and is currently estimated at $413,942, approximately $233 per square foot. 623 Claymont Dr is a home located in St. Louis County with nearby schools including Claymont Elementary School, Parkway West Middle School, and Parkway West High School.
Ownership History
Date
Name
Owned For
Owner Type
Purchase Details
Closed on
Mar 31, 2015
Sold by
Dixon David A and Dixon Carolyn
Bought by
Dixon David A and Dixon Carolyn
Current Estimated Value
Home Financials for this Owner
Home Financials are based on the most recent Mortgage that was taken out on this home.
Original Mortgage
$188,000
Outstanding Balance
$144,730
Interest Rate
3.82%
Mortgage Type
New Conventional
Estimated Equity
$269,212
Purchase Details
Closed on
Mar 14, 2001
Sold by
Laspe Sherry Ann
Bought by
Dixon David and Dixon Carolyn
Home Financials for this Owner
Home Financials are based on the most recent Mortgage that was taken out on this home.
Original Mortgage
$158,900
Interest Rate
9.99%
Purchase Details
Closed on
Jul 23, 1998
Sold by
Laspe Sally M
Bought by
Laspe Michael Alan and Laspe Sherry Ann
Home Financials for this Owner
Home Financials are based on the most recent Mortgage that was taken out on this home.
Original Mortgage
$90,000
Interest Rate
6.95%
Create a Home Valuation Report for This Property
The Home Valuation Report is an in-depth analysis detailing your home's value as well as a comparison with similar homes in the area
Home Values in the Area
Average Home Value in this Area
Purchase History
| Date | Buyer | Sale Price | Title Company |
|---|---|---|---|
| Dixon David A | -- | Title Resources Inc | |
| Dixon David | $184,900 | -- | |
| Dixon David | $184,900 | -- | |
| Laspe Michael Alan | -- | -- |
Source: Public Records
Mortgage History
| Date | Status | Borrower | Loan Amount |
|---|---|---|---|
| Open | Dixon David A | $188,000 | |
| Closed | Dixon David | $158,900 | |
| Previous Owner | Laspe Michael Alan | $90,000 |
Source: Public Records
Tax History
| Year | Tax Paid | Tax Assessment Tax Assessment Total Assessment is a certain percentage of the fair market value that is determined by local assessors to be the total taxable value of land and additions on the property. | Land | Improvement |
|---|---|---|---|---|
| 2025 | $3,867 | $68,540 | $33,690 | $34,850 |
| 2024 | $3,867 | $59,640 | $23,370 | $36,270 |
| 2023 | $3,812 | $59,640 | $23,370 | $36,270 |
| 2022 | $3,718 | $52,860 | $19,480 | $33,380 |
| 2021 | $3,696 | $52,860 | $19,480 | $33,380 |
| 2020 | $3,677 | $49,840 | $19,250 | $30,590 |
| 2019 | $3,636 | $49,840 | $19,250 | $30,590 |
| 2018 | $3,516 | $44,710 | $17,330 | $27,380 |
| 2017 | $3,416 | $44,710 | $17,330 | $27,380 |
| 2016 | $3,172 | $39,470 | $12,580 | $26,890 |
Source: Public Records
Map
Nearby Homes
- 330 Sudbury Ln
- 351 Greenbriar Ln
- 827 Woodruff Dr
- 557 Happy Ct
- 107 Falmouth Dr
- 435 Holly Terrace Ct
- 260 Monroe Mill Dr
- 314 Annondale Ln
- 120 Birchwood Dr
- 913 Crestland Dr
- 816 Crestland Dr
- 945 Warwick Ln
- 112 Shirley Ln
- 502 Richley Dr
- 216 Hillsdale Dr
- 4 Parkrose Ct
- 1019 Claytonbrook Dr Unit 1019
- 140 Burtonwood Dr
- 916 Claytonbrook Dr Unit 1
- 160 Cumberland Park Ct Unit G
- 621 Claymont Dr
- 407 Sunnyslope Dr
- 627 Claymont Dr
- 409 Sunnyslope Dr
- 401 Sunnyslope Dr
- 403 Sunnyslope Dr
- 405 Sunnyslope Dr
- 620 Claymont Dr
- 622 Claymont Dr
- 411 Sunnyslope Dr
- 618 Claymont Dr
- 629 Claymont Dr
- 700 Claymont Dr
- 616 Claymont Dr
- 414 Sunnyslope Dr
- 304 Claymont Cove Ct
- 412 Sunnyslope Dr
- 400 Sunnyslope Dr
- 400 Baberton Dr
- 413 Sunnyslope Dr