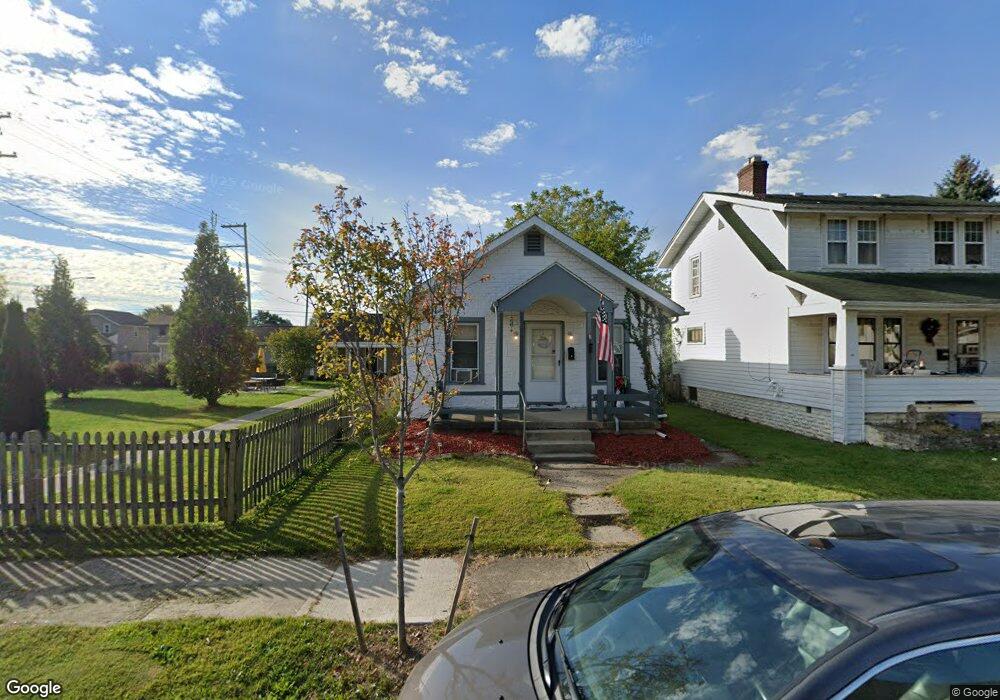
623 E Moler St Columbus, OH 43207
Vassor Village NeighborhoodEstimated Value: $128,000 - $157,000
2
Beds
1
Bath
820
Sq Ft
$179/Sq Ft
Est. Value
About This Home
This home is located at 623 E Moler St, Columbus, OH 43207 and is currently estimated at $146,593, approximately $178 per square foot. 623 E Moler St is a home located in Franklin County with nearby schools including Lincoln Park Elementary School, South High School, and South Columbus Preparatory Academy.
Ownership History
Date
Name
Owned For
Owner Type
Purchase Details
Closed on
Feb 7, 2024
Sold by
Mamie 1 Llc
Bought by
Pamco Management
Current Estimated Value
Purchase Details
Closed on
Jan 22, 2024
Sold by
Mamie 1 Llc
Bought by
Pamco Management
Purchase Details
Closed on
Jul 10, 2020
Sold by
Dahn Austin T
Bought by
Mamie 1 Llc
Purchase Details
Closed on
Jul 9, 2018
Sold by
Equity Trust Co
Bought by
Dahn Austin T
Home Financials for this Owner
Home Financials are based on the most recent Mortgage that was taken out on this home.
Original Mortgage
$47,880
Interest Rate
4.5%
Mortgage Type
New Conventional
Purchase Details
Closed on
Apr 10, 2007
Sold by
Cox Donald and Cox Nanette
Bought by
Equity Trust Co
Purchase Details
Closed on
Nov 10, 2000
Sold by
Lynn Garrison Rebecca L and Lynn Rebecca
Bought by
Cox Donald
Purchase Details
Closed on
Aug 28, 1986
Bought by
Garrison Rebecca L
Create a Home Valuation Report for This Property
The Home Valuation Report is an in-depth analysis detailing your home's value as well as a comparison with similar homes in the area
Home Values in the Area
Average Home Value in this Area
Purchase History
| Date | Buyer | Sale Price | Title Company |
|---|---|---|---|
| Pamco Management | $129,900 | Stewart Title | |
| Pamco Management | $129,900 | Stewart Title | |
| Mamie 1 Llc | -- | Crown Search Services | |
| Dahn Austin T | $59,900 | Title First Box | |
| Equity Trust Co | $44,000 | Contract Pr | |
| Cox Donald | $32,000 | Chicago Title | |
| Garrison Rebecca L | -- | -- |
Source: Public Records
Mortgage History
| Date | Status | Borrower | Loan Amount |
|---|---|---|---|
| Previous Owner | Dahn Austin T | $47,880 |
Source: Public Records
Tax History
| Year | Tax Paid | Tax Assessment Tax Assessment Total Assessment is a certain percentage of the fair market value that is determined by local assessors to be the total taxable value of land and additions on the property. | Land | Improvement |
|---|---|---|---|---|
| 2025 | $1,941 | $42,350 | $18,830 | $23,520 |
| 2024 | $1,941 | $42,350 | $18,830 | $23,520 |
| 2023 | $2,067 | $42,350 | $18,830 | $23,520 |
| 2022 | $1,025 | $16,460 | $4,380 | $12,080 |
| 2021 | $1,026 | $16,460 | $4,380 | $12,080 |
| 2020 | $878 | $16,460 | $4,380 | $12,080 |
| 2019 | $825 | $13,270 | $3,640 | $9,630 |
| 2018 | $897 | $13,270 | $3,640 | $9,630 |
| 2017 | $825 | $13,270 | $3,640 | $9,630 |
| 2016 | $1,141 | $15,680 | $3,920 | $11,760 |
| 2015 | $970 | $15,680 | $3,920 | $11,760 |
| 2014 | $972 | $15,680 | $3,920 | $11,760 |
| 2013 | $480 | $14,805 | $4,130 | $10,675 |
Source: Public Records
Map
Nearby Homes
- 676 E Moler St
- 610 Southwood Ave
- 605 Southwood Ave
- 601 Southwood Ave
- 523 Hanford St
- 704 Hanford St
- 513 E Jenkins Ave
- 573 E Mithoff St
- 650 E Mithoff St
- 0 Gilbert St
- 423 Sheldon Ave
- 515 E Mithoff St
- 415 Sheldon Ave
- 1263 Heyl Ave
- 693 Thurman Ave
- 1657 Ann St
- 524 Thurman Ave
- 495 E Welch Ave
- 539 Thurman Ave
- 798 E Mithoff St
- 619 E Moler St
- 615 E Moler St
- 611 E Moler St
- 607 E Moler St
- 622 Sheldon Ave
- 618 Sheldon Ave
- 626 Sheldon Ave
- 645 E Moler St
- 620 E Moler St
- 614 Sheldon Ave
- 630 Sheldon Ave
- 601 E Moler St
- 628 E Moler St
- 620 E Moler St
- 608 Sheldon Ave
- 634 E Moler St
- 614 E Moler St
- 604 Sheldon Ave
- 597 E Moler St
- 651 E Moler St
Your Personal Tour Guide
Ask me questions while you tour the home.