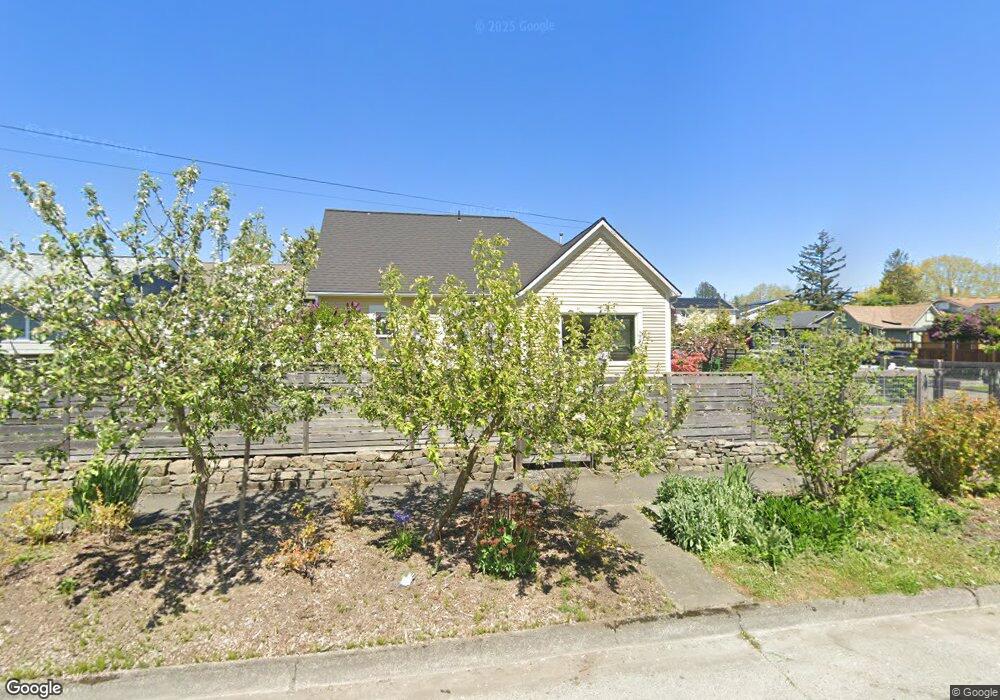
623 E North St Bellingham, WA 98225
Sunnyland NeighborhoodEstimated Value: $516,000 - $667,092
3
Beds
2
Baths
1,247
Sq Ft
$467/Sq Ft
Est. Value
About This Home
This home is located at 623 E North St, Bellingham, WA 98225 and is currently estimated at $582,523, approximately $467 per square foot. 623 E North St is a home located in Whatcom County with nearby schools including Sunnyland Elementary School, Whatcom Middle School, and Bellingham High School.
Ownership History
Date
Name
Owned For
Owner Type
Purchase Details
Closed on
Oct 7, 2024
Sold by
Waldo Tyson Zane
Bought by
Liu Fengtsui
Current Estimated Value
Purchase Details
Closed on
Nov 2, 2005
Sold by
Anderson Linda
Bought by
Waldo Tyson Z and Liu Feng Tsui
Home Financials for this Owner
Home Financials are based on the most recent Mortgage that was taken out on this home.
Original Mortgage
$38,250
Interest Rate
7.87%
Mortgage Type
Stand Alone Second
Purchase Details
Closed on
Apr 8, 2004
Sold by
Rose Patricia O and Rogers Patricia O
Bought by
Gourlie Burr W T
Home Financials for this Owner
Home Financials are based on the most recent Mortgage that was taken out on this home.
Original Mortgage
$137,400
Interest Rate
5.56%
Mortgage Type
Purchase Money Mortgage
Create a Home Valuation Report for This Property
The Home Valuation Report is an in-depth analysis detailing your home's value as well as a comparison with similar homes in the area
Home Values in the Area
Average Home Value in this Area
Purchase History
| Date | Buyer | Sale Price | Title Company |
|---|---|---|---|
| Liu Fengtsui | $313 | None Listed On Document | |
| Liu Fengtsui | $313 | None Listed On Document | |
| Waldo Tyson Z | $255,280 | First American Title Insuran | |
| Gourlie Burr W T | $171,750 | First American Title Insuran |
Source: Public Records
Mortgage History
| Date | Status | Borrower | Loan Amount |
|---|---|---|---|
| Previous Owner | Waldo Tyson Z | $38,250 | |
| Previous Owner | Waldo Tyson Z | $204,000 | |
| Previous Owner | Gourlie Burr W T | $137,400 |
Source: Public Records
Tax History Compared to Growth
Tax History
| Year | Tax Paid | Tax Assessment Tax Assessment Total Assessment is a certain percentage of the fair market value that is determined by local assessors to be the total taxable value of land and additions on the property. | Land | Improvement |
|---|---|---|---|---|
| 2024 | $4,427 | $554,606 | $246,304 | $308,302 |
| 2023 | $4,427 | $568,693 | $252,560 | $316,133 |
| 2022 | $3,614 | $490,261 | $217,728 | $272,533 |
| 2021 | $3,546 | $389,096 | $172,800 | $216,296 |
| 2020 | $3,572 | $360,274 | $160,000 | $200,274 |
| 2019 | $3,198 | $350,813 | $146,406 | $204,407 |
| 2018 | $3,220 | $314,907 | $131,446 | $183,461 |
| 2017 | $2,777 | $271,125 | $113,168 | $157,957 |
| 2016 | $2,430 | $244,354 | $101,552 | $142,802 |
| 2015 | $2,383 | $222,616 | $92,752 | $129,864 |
| 2014 | -- | $211,211 | $88,000 | $123,211 |
| 2013 | -- | $204,835 | $82,950 | $121,885 |
Source: Public Records
Map
Nearby Homes
- 2627 Iron St
- 607 E Illinois St
- 2430 Ellis St
- 2500 Cornwall Ave
- 214 Carolina St
- 2929 Nevada St
- 2716 Sunset Dr
- 3020 E North St
- 3024 E North St
- 2914 Cornwall Ave
- 2518 S Park Dr
- 2014 Iron St
- 2318 F St
- 2008 Iron St
- 2306 C St
- 2019 Cornwall Ave
- 710 W North St
- 1737 Sunup Loop
- 1735 Sunup Loop
- 1733 Sunup Loop