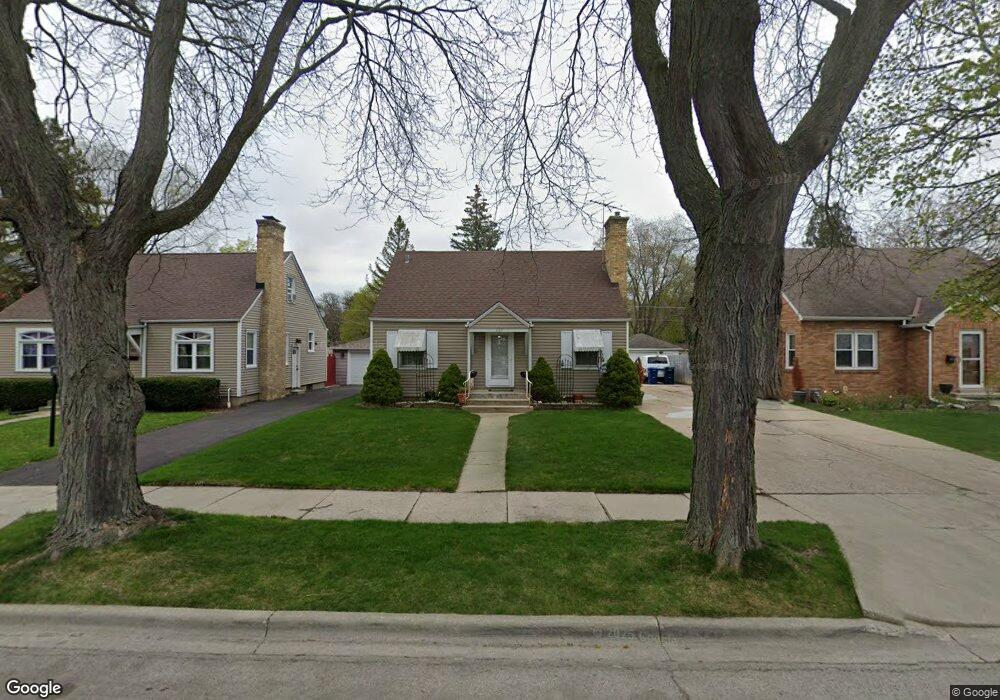
623 Lorraine Ave Waukegan, IL 60085
Lorraine Terrace NeighborhoodEstimated Value: $152,000 - $240,000
3
Beds
1
Bath
990
Sq Ft
$206/Sq Ft
Est. Value
About This Home
This home is located at 623 Lorraine Ave, Waukegan, IL 60085 and is currently estimated at $204,156, approximately $206 per square foot. 623 Lorraine Ave is a home located in Lake County with nearby schools including Hyde Park Elementary School, Miguel Juarez Middle School, and Waukegan High School.
Ownership History
Date
Name
Owned For
Owner Type
Purchase Details
Closed on
Jan 28, 2009
Sold by
Hsbc Mortgage Services Inc
Bought by
Rios Ayala Nicolas and Rios Maria
Current Estimated Value
Home Financials for this Owner
Home Financials are based on the most recent Mortgage that was taken out on this home.
Original Mortgage
$60,400
Interest Rate
5.2%
Mortgage Type
Purchase Money Mortgage
Purchase Details
Closed on
Oct 8, 2008
Sold by
Fajardo
Bought by
Hsbc Mortgage Services Inc
Purchase Details
Closed on
Jul 27, 2000
Sold by
Diamond Ronelle and Estate Of Evelyn Gannon
Bought by
Ortiz Jose L and Fajardo Leticia
Home Financials for this Owner
Home Financials are based on the most recent Mortgage that was taken out on this home.
Original Mortgage
$110,327
Interest Rate
8.24%
Mortgage Type
FHA
Create a Home Valuation Report for This Property
The Home Valuation Report is an in-depth analysis detailing your home's value as well as a comparison with similar homes in the area
Home Values in the Area
Average Home Value in this Area
Purchase History
| Date | Buyer | Sale Price | Title Company |
|---|---|---|---|
| Rios Ayala Nicolas | $75,500 | Forum Title Insurance Co | |
| Hsbc Mortgage Services Inc | -- | None Available | |
| Ortiz Jose L | $110,500 | Ticor Title |
Source: Public Records
Mortgage History
| Date | Status | Borrower | Loan Amount |
|---|---|---|---|
| Previous Owner | Rios Ayala Nicolas | $60,400 | |
| Previous Owner | Ortiz Jose L | $110,327 |
Source: Public Records
Tax History Compared to Growth
Tax History
| Year | Tax Paid | Tax Assessment Tax Assessment Total Assessment is a certain percentage of the fair market value that is determined by local assessors to be the total taxable value of land and additions on the property. | Land | Improvement |
|---|---|---|---|---|
| 2024 | $4,635 | $54,901 | $10,962 | $43,939 |
| 2023 | $4,302 | $49,153 | $9,814 | $39,339 |
| 2022 | $4,302 | $44,005 | $8,946 | $35,059 |
| 2021 | $4,018 | $38,535 | $8,426 | $30,109 |
| 2020 | $4,069 | $35,900 | $7,850 | $28,050 |
| 2019 | $4,096 | $32,896 | $7,193 | $25,703 |
| 2018 | $3,382 | $26,157 | $8,485 | $17,672 |
| 2017 | $3,292 | $23,142 | $7,507 | $15,635 |
| 2016 | $3,108 | $23,313 | $6,523 | $16,790 |
| 2015 | $3,040 | $20,865 | $5,838 | $15,027 |
| 2014 | $3,323 | $19,643 | $5,323 | $14,320 |
| 2012 | $4,119 | $21,279 | $5,766 | $15,513 |
Source: Public Records
Map
Nearby Homes
- 1213 Grand Ave
- 824 N Butrick St
- 968 Judge Ave
- 2115 Lydia St
- 615 Tiffany Dr
- 1005 N Lewis Ave
- 1109 Massena Ave
- 1023 N Elmwood Ave
- 1000 Pine St
- 1038 Indiana Ave
- 917 N Linden Ave
- 132 Dorchester Ct
- 1117 Judge Ave
- 1416 Hamilton Ct
- 511 Chestnut St
- 1105 Woodlawn Cir
- 1504 W Glen Flora Ave
- 620 N Poplar St
- 522 N Poplar St
- 702 Franklin St
- 617 Lorraine Ave
- 625 Lorraine Ave
- 615 Lorraine Ave
- 627 Lorraine Ave
- 611 Lorraine Ave
- 631 Lorraine Ave
- 626 Judge Ave
- 628 Judge Ave
- 622 Judge Ave
- 632 Judge Ave
- 616 Judge Ave
- 635 Lorraine Ave
- 607 Lorraine Ave
- 634 Judge Ave
- 614 Judge Ave
- 622 Lorraine Ave
- 626 Lorraine Ave
- 618 Lorraine Ave
- 636 Judge Ave
- 630 Lorraine Ave