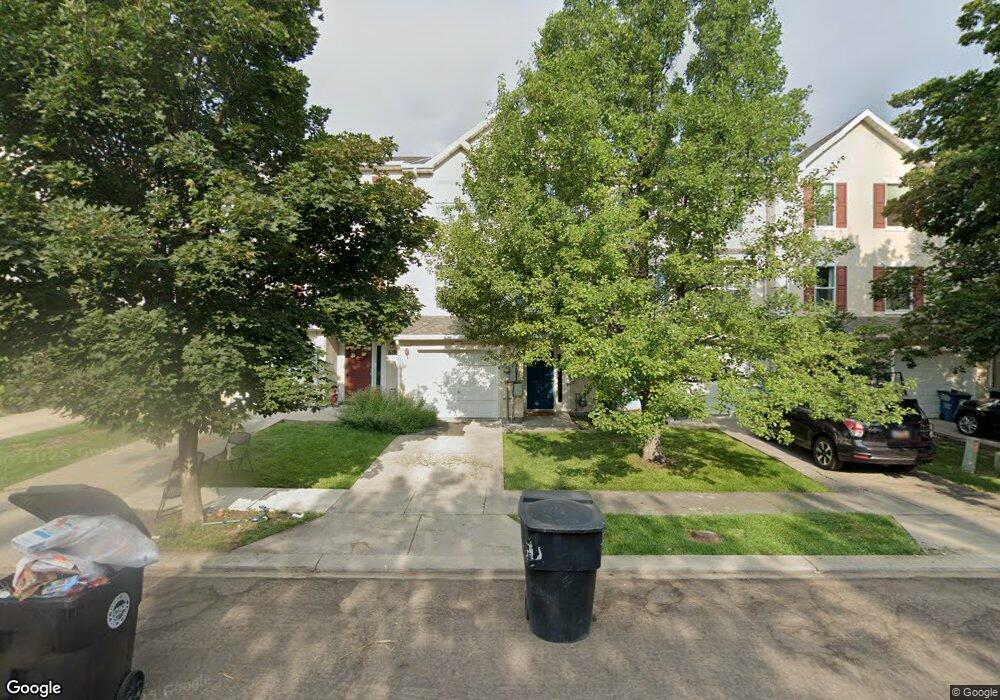
623 N Royal Troon Dr Heber City, UT 84032
Estimated Value: $426,000 - $557,000
3
Beds
3
Baths
1,608
Sq Ft
$297/Sq Ft
Est. Value
About This Home
This home is located at 623 N Royal Troon Dr, Heber City, UT 84032 and is currently estimated at $477,101, approximately $296 per square foot. 623 N Royal Troon Dr is a home located in Wasatch County with nearby schools including Heber Valley Elementary School, Rocky Mountain Middle School, and Wasatch High School.
Ownership History
Date
Name
Owned For
Owner Type
Purchase Details
Closed on
Oct 11, 2023
Sold by
Bvhv Sfr 2022-1 Llc
Bought by
Winkle Meghan and Cowan Chris
Current Estimated Value
Home Financials for this Owner
Home Financials are based on the most recent Mortgage that was taken out on this home.
Original Mortgage
$355,200
Interest Rate
7.18%
Mortgage Type
New Conventional
Purchase Details
Closed on
Jul 14, 2023
Sold by
Deollos Matt and Deollos Andreia
Bought by
Bvhv Sfr 2022-1 Llc
Purchase Details
Closed on
Jun 30, 2008
Sold by
Hadley David A and Hadley Pauline M
Bought by
Deollos Matt and Deollos Andreia
Home Financials for this Owner
Home Financials are based on the most recent Mortgage that was taken out on this home.
Original Mortgage
$196,910
Interest Rate
6.04%
Mortgage Type
FHA
Create a Home Valuation Report for This Property
The Home Valuation Report is an in-depth analysis detailing your home's value as well as a comparison with similar homes in the area
Home Values in the Area
Average Home Value in this Area
Purchase History
| Date | Buyer | Sale Price | Title Company |
|---|---|---|---|
| Winkle Meghan | -- | Northern Title Company | |
| Bvhv Sfr 2022-1 Llc | -- | Rei Title | |
| Deollos Matt | -- | First American Union Park |
Source: Public Records
Mortgage History
| Date | Status | Borrower | Loan Amount |
|---|---|---|---|
| Previous Owner | Winkle Meghan | $355,200 | |
| Previous Owner | Deollos Matt | $196,910 |
Source: Public Records
Tax History Compared to Growth
Tax History
| Year | Tax Paid | Tax Assessment Tax Assessment Total Assessment is a certain percentage of the fair market value that is determined by local assessors to be the total taxable value of land and additions on the property. | Land | Improvement |
|---|---|---|---|---|
| 2025 | $2,163 | $411,250 | $200,000 | $211,250 |
| 2024 | $2,163 | $425,120 | $200,000 | $225,120 |
| 2023 | $2,124 | $412,012 | $125,000 | $287,012 |
| 2022 | $1,968 | $353,760 | $110,000 | $243,760 |
| 2021 | $2,032 | $290,139 | $115,000 | $175,139 |
| 2020 | $1,972 | $240,494 | $55,000 | $185,494 |
| 2019 | $1,639 | $132,272 | $0 | $0 |
| 2018 | $1,524 | $122,997 | $0 | $0 |
| 2017 | $1,382 | $110,900 | $0 | $0 |
| 2016 | $1,313 | $102,650 | $0 | $0 |
| 2015 | $1,253 | $102,650 | $0 | $0 |
| 2014 | $784 | $63,697 | $0 | $0 |
Source: Public Records
Map
Nearby Homes
- 623 Royal Troon Dr
- 627 Royal Troon Dr
- 619 Royal Troon Dr
- 633 Royal Troon Dr
- 615 N Royal Troon Dr Unit 615
- 615 Royal Troon Dr
- 637 N 310 W
- 637 Royal Troon Dr
- 611 Royal Troon Dr
- 344 W 650 N
- 624 N 360 W
- 628 Glen Livet Ln
- 620 Glen Livet Ln
- 634 Glen Livet Ln
- 616 N 360 W
- 616 Glen Livet Ln
- 638 N 360 W
- 638 Glen Livet Ln
- 638 Glen Livet Ln Unit 280
- 624 Glen Livet Ln