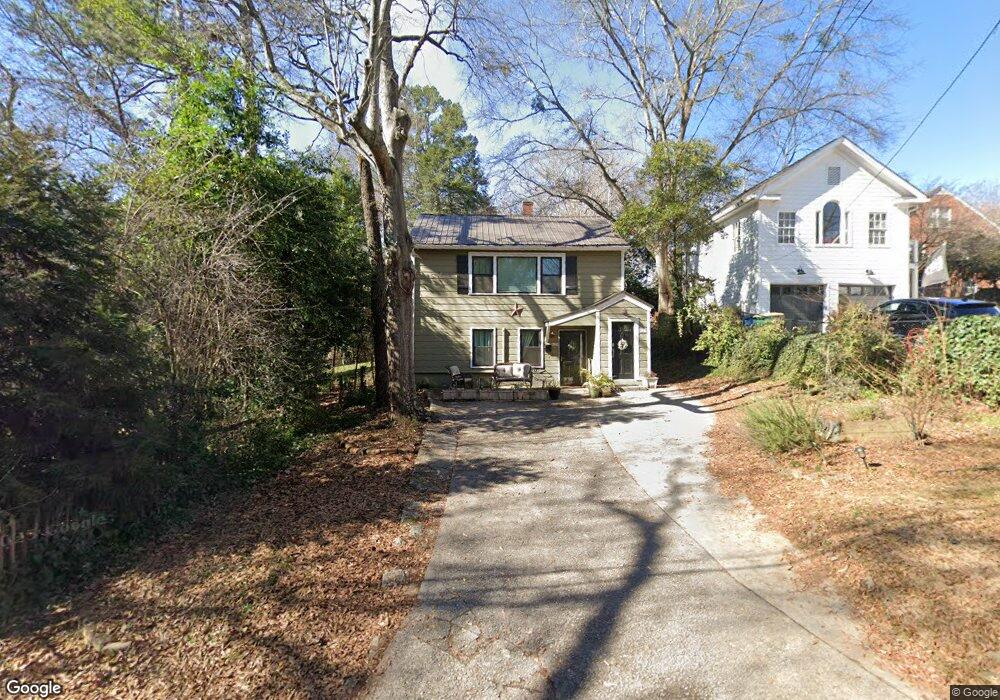
623 Pinecrest Dr Athens, GA 30605
Five Points NeighborhoodEstimated Value: $441,384 - $590,000
3
Beds
2
Baths
1,248
Sq Ft
$407/Sq Ft
Est. Value
About This Home
This home is located at 623 Pinecrest Dr, Athens, GA 30605 and is currently estimated at $507,596, approximately $406 per square foot. 623 Pinecrest Dr is a home located in Clarke County with nearby schools including Barrow Elementary School, Clarke Middle School, and Clarke Central High School.
Ownership History
Date
Name
Owned For
Owner Type
Purchase Details
Closed on
Sep 20, 2021
Sold by
Seelos Ashley
Bought by
Wagner Anita and Wagner Andreas
Current Estimated Value
Home Financials for this Owner
Home Financials are based on the most recent Mortgage that was taken out on this home.
Original Mortgage
$222,000
Outstanding Balance
$167,150
Interest Rate
2.8%
Mortgage Type
New Conventional
Estimated Equity
$340,446
Purchase Details
Closed on
Mar 30, 2018
Sold by
Oconee Ventures Llc
Bought by
Seelos Ashley
Home Financials for this Owner
Home Financials are based on the most recent Mortgage that was taken out on this home.
Original Mortgage
$161,879
Interest Rate
4.43%
Mortgage Type
New Conventional
Purchase Details
Closed on
Aug 10, 2009
Sold by
Thornwood Properties Llc
Bought by
Oconee Ventures Llc
Purchase Details
Closed on
Aug 21, 2002
Sold by
Thornton Michael A and Thornton Kenneth A
Bought by
Thornwood Properties Llc
Purchase Details
Closed on
Jan 25, 2000
Sold by
Lewis Miles Walker Decd
Bought by
Easley Charles E
Create a Home Valuation Report for This Property
The Home Valuation Report is an in-depth analysis detailing your home's value as well as a comparison with similar homes in the area
Home Values in the Area
Average Home Value in this Area
Purchase History
| Date | Buyer | Sale Price | Title Company |
|---|---|---|---|
| Wagner Anita | $412,000 | -- | |
| Seelos Ashley | $175,000 | -- | |
| Oconee Ventures Llc | $110,000 | -- | |
| Thornwood Properties Llc | -- | -- | |
| Thornton Michael A | $110,000 | -- | |
| Easley Charles E | -- | -- |
Source: Public Records
Mortgage History
| Date | Status | Borrower | Loan Amount |
|---|---|---|---|
| Open | Wagner Anita | $222,000 | |
| Previous Owner | Seelos Ashley | $161,879 |
Source: Public Records
Tax History
| Year | Tax Paid | Tax Assessment Tax Assessment Total Assessment is a certain percentage of the fair market value that is determined by local assessors to be the total taxable value of land and additions on the property. | Land | Improvement |
|---|---|---|---|---|
| 2025 | $5,092 | $163,995 | $60,000 | $103,995 |
| 2024 | $5,092 | $152,045 | $60,000 | $92,045 |
| 2023 | $4,751 | $139,266 | $60,000 | $79,266 |
| 2022 | $3,643 | $114,202 | $44,000 | $70,202 |
| 2021 | $2,115 | $72,774 | $35,200 | $37,574 |
| 2020 | $2,008 | $69,574 | $32,000 | $37,574 |
| 2019 | $2,023 | $69,574 | $32,000 | $37,574 |
| 2018 | $1,718 | $50,598 | $30,000 | $20,598 |
| 2017 | $1,718 | $50,598 | $30,000 | $20,598 |
| 2016 | $1,568 | $46,184 | $32,000 | $14,184 |
| 2015 | $1,461 | $42,984 | $28,800 | $14,184 |
| 2014 | $1,464 | $42,984 | $28,800 | $14,184 |
Source: Public Records
Map
Nearby Homes
- 293 Southview Dr
- 145 Riverdale Dr
- 1697 S Milledge Ave
- 183 Parkway Dr
- 760 E Campus Rd Unit 95
- 655 E Campus Rd Unit 33
- 655 E Campus Rd
- 655 E Campus Rd Unit 12
- 115 Annes Ct
- 150 Gran Ellen Dr
- 301 Parkway Dr
- 1775 S Milledge Ave Unit 15
- 230 Milledge Terrace
- 128 Habersham Dr
- 170 Northview Dr Unit 5
- 390 Milledge Terrace
- 173 Westview Dr
- 1905 S Milledge Ave Unit 36
- 1905 S Milledge Ave Unit 5
- 1554 S Lumpkin St Unit 4
- 625 Pinecrest Dr
- 623 - 625 Pinecrest Dr
- 623 Pinecrest Dr
- 629 Pinecrest Dr
- 272 Southview Dr
- 282 Southview Dr
- 310 Southview Dr
- 631 Pinecrest Dr
- 620 Pinecrest Dr
- 260 Southview Dr
- 630 Pinecrest Dr
- 320 Southview Dr
- 250 Southview Dr
- 635 Pinecrest Dr
- 330 Southview Dr
- 640 Pinecrest Dr
- 10 Milledge Ct
- 240 Southview Dr
- 117 Hardin Dr
- 305 Southview Dr
Your Personal Tour Guide
Ask me questions while you tour the home.