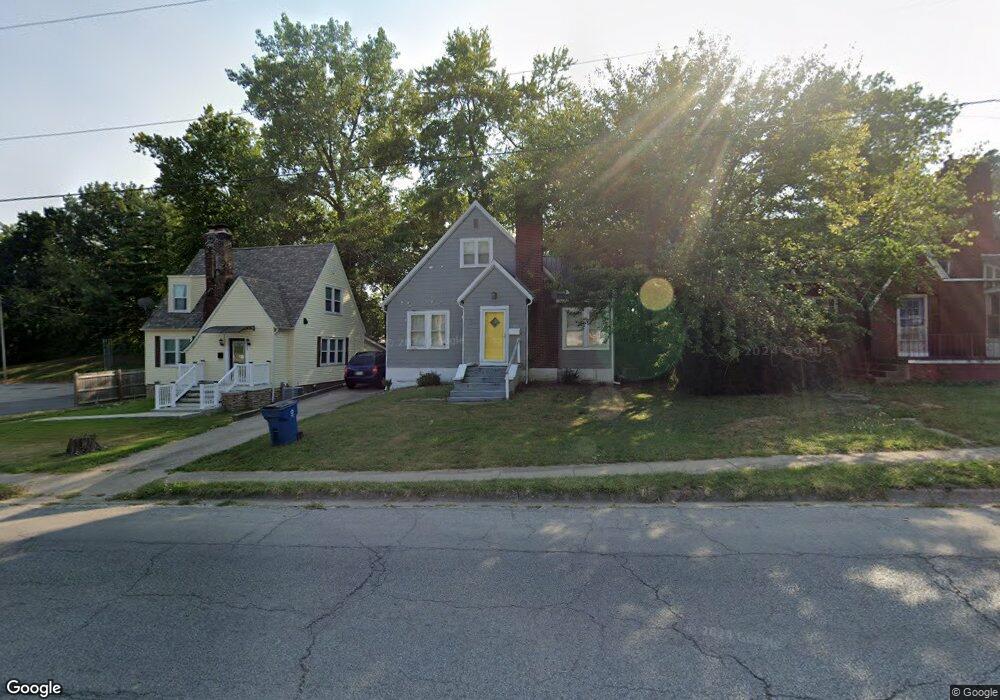
623 Salem Rd Mount Vernon, IL 62864
Estimated Value: $62,000 - $97,000
3
Beds
1
Bath
--
Sq Ft
9,583
Sq Ft Lot
About This Home
This home is located at 623 Salem Rd, Mount Vernon, IL 62864 and is currently estimated at $84,994. 623 Salem Rd is a home located in Jefferson County with nearby schools including Osborne Primary Center, J.L. Buford Intermediate Education Center, and Zadok Casey Middle School.
Ownership History
Date
Name
Owned For
Owner Type
Purchase Details
Closed on
Mar 31, 2025
Sold by
Smith Michael S and Smith Angela
Bought by
Fanning Keith
Current Estimated Value
Home Financials for this Owner
Home Financials are based on the most recent Mortgage that was taken out on this home.
Original Mortgage
$85,424
Outstanding Balance
$84,760
Interest Rate
6.85%
Mortgage Type
New Conventional
Estimated Equity
$234
Purchase Details
Closed on
Dec 12, 2024
Sold by
Smith Michael S and Smith Angela S
Bought by
Michael S Smith And Angela S Owens Smith Fami and Smith
Purchase Details
Closed on
Jun 27, 2008
Sold by
Goodman Brenda A
Bought by
Smith Michael S
Home Financials for this Owner
Home Financials are based on the most recent Mortgage that was taken out on this home.
Original Mortgage
$57,600
Interest Rate
6.36%
Mortgage Type
Purchase Money Mortgage
Create a Home Valuation Report for This Property
The Home Valuation Report is an in-depth analysis detailing your home's value as well as a comparison with similar homes in the area
Home Values in the Area
Average Home Value in this Area
Purchase History
| Date | Buyer | Sale Price | Title Company |
|---|---|---|---|
| Fanning Keith | $87,000 | None Listed On Document | |
| Michael S Smith And Angela S Owens Smith Fami | -- | None Listed On Document | |
| Smith Michael S | $72,000 | None Available |
Source: Public Records
Mortgage History
| Date | Status | Borrower | Loan Amount |
|---|---|---|---|
| Open | Fanning Keith | $85,424 | |
| Previous Owner | Smith Michael S | $57,600 |
Source: Public Records
Tax History
| Year | Tax Paid | Tax Assessment Tax Assessment Total Assessment is a certain percentage of the fair market value that is determined by local assessors to be the total taxable value of land and additions on the property. | Land | Improvement |
|---|---|---|---|---|
| 2024 | $1,732 | $19,949 | $5,351 | $14,598 |
| 2023 | $1,611 | $18,417 | $4,940 | $13,477 |
| 2022 | $1,563 | $16,155 | $4,333 | $11,822 |
| 2021 | $1,496 | $15,386 | $4,127 | $11,259 |
| 2020 | $1,500 | $14,379 | $3,857 | $10,522 |
| 2019 | $1,479 | $14,379 | $3,857 | $10,522 |
| 2018 | $1,462 | $14,379 | $3,857 | $10,522 |
| 2017 | $1,430 | $14,379 | $3,857 | $10,522 |
| 2016 | $1,396 | $14,379 | $3,857 | $10,522 |
| 2015 | $1,366 | $14,379 | $3,857 | $10,522 |
| 2014 | $1,125 | $14,379 | $3,857 | $10,522 |
| 2013 | $1,125 | $13,565 | $3,639 | $9,926 |
Source: Public Records
Map
Nearby Homes
- 1126 Oakland Ave
- 1609 Isabella Ave
- 1122 Maple St
- 625 N 12th St
- 1005 Pace Ave
- 0000 Illinois 15
- 000 Benton Rd
- 1715 Oakland Ave
- 713 N 10th St
- 210 N 12th St Unit 206 N
- 704 N 8th St
- 710 Pavey Ave
- 400 N 8th St
- 21 Rushton Dr
- 215 N 8th St
- 207 N 8th St
- 724 Park Ave
- 9485 Illinois 15
- 1024 Tolle Rd
- 725 Dewey Ave
- 625 Salem Rd
- 709 Salem Rd Unit 709 1/2
- 711 Salem Rd
- 711 Salem 00
- 1408 Mcpherson Ave
- 710 Salem Rd
- 1407 Mcpherson Ave
- 1402 Mcpherson Ave
- 714 Salem Rd
- 715 Salem Rd
- 716 Salem Rd
- #2 #2 Hinman Place
- 2 Hinman Place
- 601 Kensington Ave Unit 603
- 622 Kensington Ave
- 624 Kensington Ave
- 717 Salem Rd
- 611 Salem Rd
- 628 Kensington Ave
- 605 Kensington Ave
Your Personal Tour Guide
Ask me questions while you tour the home.