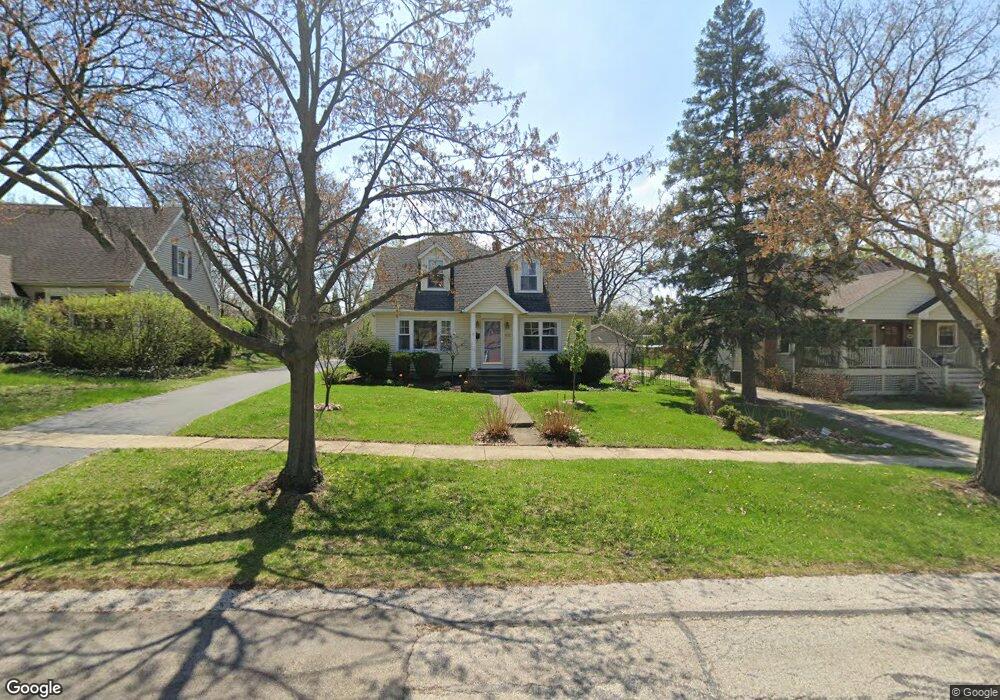
623 Sherman St Downers Grove, IL 60515
Estimated Value: $710,000 - $882,000
--
Bed
1
Bath
2,209
Sq Ft
$348/Sq Ft
Est. Value
About This Home
This home is located at 623 Sherman St, Downers Grove, IL 60515 and is currently estimated at $768,245, approximately $347 per square foot. 623 Sherman St is a home located in DuPage County with nearby schools including Lester Elementary School, Herrick Middle School, and Downer Grove North High School.
Ownership History
Date
Name
Owned For
Owner Type
Purchase Details
Closed on
May 15, 1997
Sold by
Zimmerman Robert J and Zimmerman Suzanne K
Bought by
Laffey Myles J and Laffey Jennifer A
Current Estimated Value
Home Financials for this Owner
Home Financials are based on the most recent Mortgage that was taken out on this home.
Original Mortgage
$147,600
Outstanding Balance
$20,689
Interest Rate
8.27%
Estimated Equity
$747,556
Purchase Details
Closed on
Oct 1, 1993
Sold by
Kempinski Evelyn J
Bought by
Zimmerman Robert J and Zimmerman Suzanne K
Home Financials for this Owner
Home Financials are based on the most recent Mortgage that was taken out on this home.
Original Mortgage
$144,750
Interest Rate
7.05%
Create a Home Valuation Report for This Property
The Home Valuation Report is an in-depth analysis detailing your home's value as well as a comparison with similar homes in the area
Home Values in the Area
Average Home Value in this Area
Purchase History
| Date | Buyer | Sale Price | Title Company |
|---|---|---|---|
| Laffey Myles J | $164,000 | Collar Counties Title Plant | |
| Zimmerman Robert J | $152,500 | -- |
Source: Public Records
Mortgage History
| Date | Status | Borrower | Loan Amount |
|---|---|---|---|
| Open | Laffey Myles J | $147,600 | |
| Previous Owner | Zimmerman Robert J | $144,750 |
Source: Public Records
Tax History Compared to Growth
Tax History
| Year | Tax Paid | Tax Assessment Tax Assessment Total Assessment is a certain percentage of the fair market value that is determined by local assessors to be the total taxable value of land and additions on the property. | Land | Improvement |
|---|---|---|---|---|
| 2024 | $11,900 | $215,852 | $79,137 | $136,715 |
| 2023 | $11,320 | $198,430 | $72,750 | $125,680 |
| 2022 | $10,704 | $187,880 | $68,880 | $119,000 |
| 2021 | $10,021 | $185,750 | $68,100 | $117,650 |
| 2020 | $9,836 | $182,070 | $66,750 | $115,320 |
| 2019 | $9,528 | $174,700 | $64,050 | $110,650 |
| 2018 | $9,124 | $165,640 | $63,690 | $101,950 |
| 2017 | $8,837 | $159,390 | $61,290 | $98,100 |
| 2016 | $8,665 | $152,110 | $58,490 | $93,620 |
| 2015 | $8,575 | $143,110 | $55,030 | $88,080 |
| 2014 | $7,643 | $127,940 | $48,640 | $79,300 |
| 2013 | $7,488 | $127,340 | $48,410 | $78,930 |
Source: Public Records
Map
Nearby Homes
- 727 Grant St
- 4532 Sherwood Ave
- 425 Sherman St
- 4117 Sterling Rd
- Lot 3910 Sterling Rd
- 505 Lincoln Ave
- 4111 Douglas Rd
- 541 Chicago Ave
- 416 Chicago Ave
- 509 Gierz St
- 4218 Florence Ave
- 624 Prairie Ave
- 536 Prairie Ave
- 4133 Lindley St
- 4225 Highland Ave
- 4533 Highland Ave
- 248 41st St
- 420 Wilson St
- 312 Prairie Ave
- 3910 Sterling Rd
- 617 Sherman St
- 627 Sherman St
- 635 Sherman St
- 611 Sherman St
- 4411 Stanley Ave
- 620 Sherman St
- 610 Davis St
- 626 Sherman St
- 639 Sherman St
- 4417 Stanley Ave
- 632 Sherman St
- 609 Sherman St
- 636 Sherman St
- 616 Sherman St
- 4428 Sterling Rd
- 601 Sherman St
- 604 Davis St
- 4421 Stanley Ave
- 4339 Stanley Ave
- 608 Sherman St