Estimated Value: $734,000 - $786,000
7
Beds
2
Baths
4,533
Sq Ft
$170/Sq Ft
Est. Value
About This Home
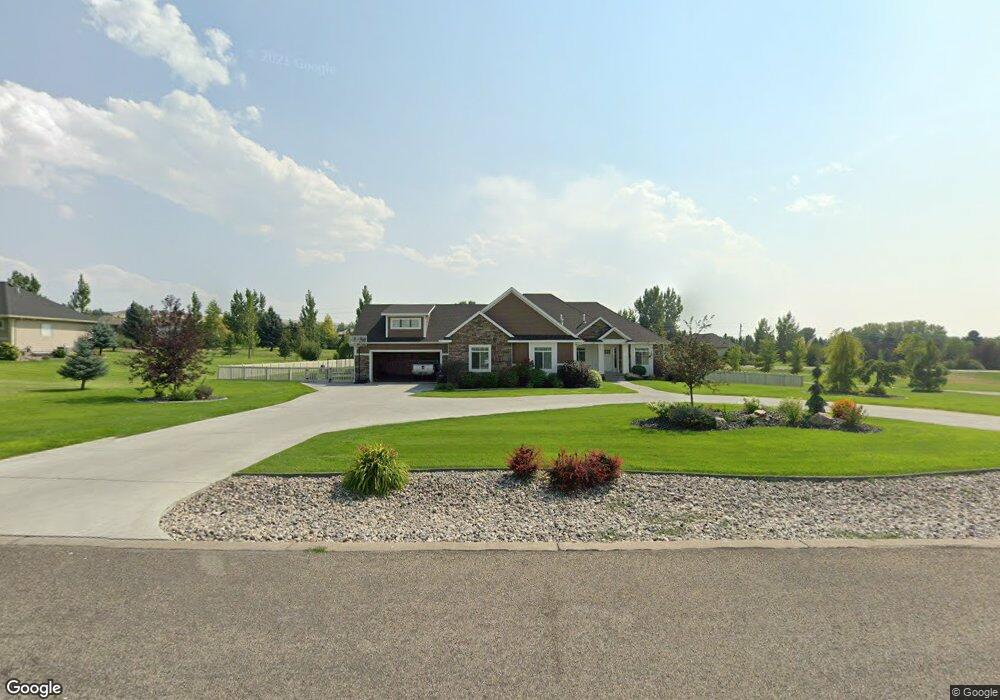
This home is located at 6230 Bobwhite Dr, Ammon, ID 83401 and is currently estimated at $772,273, approximately $170 per square foot. 6230 Bobwhite Dr is a home with nearby schools including Rimrock Elementary School, Sandcreek Middle School, and Hillcrest High School.
Ownership History
Date
Name
Owned For
Owner Type
Purchase Details
Closed on
Nov 5, 2015
Sold by
Jky Properties Llc
Bought by
Burke Terry and Burke Brittney
Current Estimated Value
Home Financials for this Owner
Home Financials are based on the most recent Mortgage that was taken out on this home.
Original Mortgage
$379,595
Outstanding Balance
$298,772
Interest Rate
3.81%
Mortgage Type
New Conventional
Estimated Equity
$473,501
Purchase Details
Closed on
Feb 19, 2015
Sold by
Murri Blake and Janell Murri D
Bought by
Hawkes Gerald and Hawkes Dorcas A
Purchase Details
Closed on
Feb 17, 2015
Sold by
Hawkes Gerald and Hawkes Dorcas A
Bought by
Jky Properties Llc
Purchase Details
Closed on
Aug 6, 2010
Sold by
Hawkes Gerald E and Murri Blake
Bought by
City Of Ammon
Purchase Details
Closed on
Dec 24, 2005
Sold by
Hillpoint Properties Llc
Bought by
Murri Blake and Hawkes Gerald E
Create a Home Valuation Report for This Property
The Home Valuation Report is an in-depth analysis detailing your home's value as well as a comparison with similar homes in the area
Home Values in the Area
Average Home Value in this Area
Purchase History
| Date | Buyer | Sale Price | Title Company |
|---|---|---|---|
| Burke Terry | -- | Pioneer Title Co | |
| Hawkes Gerald | -- | Pioneer Title Company Of Bon | |
| Jky Properties Llc | -- | Pioneer Title Co | |
| City Of Ammon | -- | -- | |
| Murri Blake | -- | -- |
Source: Public Records
Mortgage History
| Date | Status | Borrower | Loan Amount |
|---|---|---|---|
| Open | Burke Terry | $379,595 |
Source: Public Records
Tax History Compared to Growth
Tax History
| Year | Tax Paid | Tax Assessment Tax Assessment Total Assessment is a certain percentage of the fair market value that is determined by local assessors to be the total taxable value of land and additions on the property. | Land | Improvement |
|---|---|---|---|---|
| 2025 | $4,035 | $785,854 | $884 | $784,970 |
| 2024 | $4,035 | $882,586 | $113,256 | $769,330 |
| 2023 | $3,519 | $739,160 | $114,140 | $625,020 |
| 2022 | $4,054 | $615,868 | $79,728 | $536,140 |
| 2021 | $4,536 | $474,148 | $72,758 | $401,390 |
| 2019 | $4,925 | $449,722 | $68,402 | $381,320 |
| 2018 | $4,649 | $466,393 | $65,353 | $401,040 |
| 2017 | $4,202 | $436,724 | $62,304 | $374,420 |
| 2016 | $4,018 | $405,292 | $37,692 | $367,600 |
| 2015 | $422 | $391,552 | $37,692 | $353,860 |
| 2014 | $11,277 | $32,029 | $32,029 | $0 |
| 2013 | $455 | $35,107 | $33,156 | $1,951 |
Source: Public Records
Map
Nearby Homes
- TBD E Foothill Rd
- TBD Purple Sage Dr
- 6588 E Crown Crescent
- 6568 E Crown Crescent
- 6482 E Crown Crescent
- L8 B3 Ridge River Dr
- 3037 Lancer Ave
- 3097 Granger St
- 3164 Granger St
- 3184 S Chartwell Gardens
- 3669 S Purple Sage Dr
- 3083 Lancer Ave
- 3344 Lancer Ave
- 3185 Lancer Ave
- 3133 Lancer Ave
- 3299 Chester Driver
- Stanton Plan at Brogan Creek - Brogan Creek Subdivision
- Ravenstone Plan at Brogan Creek - Brogan Creek Subdivision
- Kensington Plan at Brogan Creek - Brogan Creek Subdivision
- Edgeworth Plan at Brogan Creek - Brogan Creek Subdivision
- 6260 Bob White Dr
- 6260 Bobwhite Dr
- 1955 Sage Hen Ln
- 6245 Bobwhite Dr
- TBD S Quail Ridge Dr
- 6290 Bobwhite Dr
- 2143 Quail Ridge Dr
- 1950 Sage Hen Ln
- 6279 Bob White Dr
- 6279 Bobwhite Dr
- 2138 Quail Ridge Dr
- 1907 Sage Hen Dr
- 1907 Sage Hen Ln
- 2009 S 60th E
- 2061 S 60th E
- 2040 Hungarian Way
- 6249 E Partridge Cir
- 6313 Bob White Dr
- 1910 Sage Hen Ln