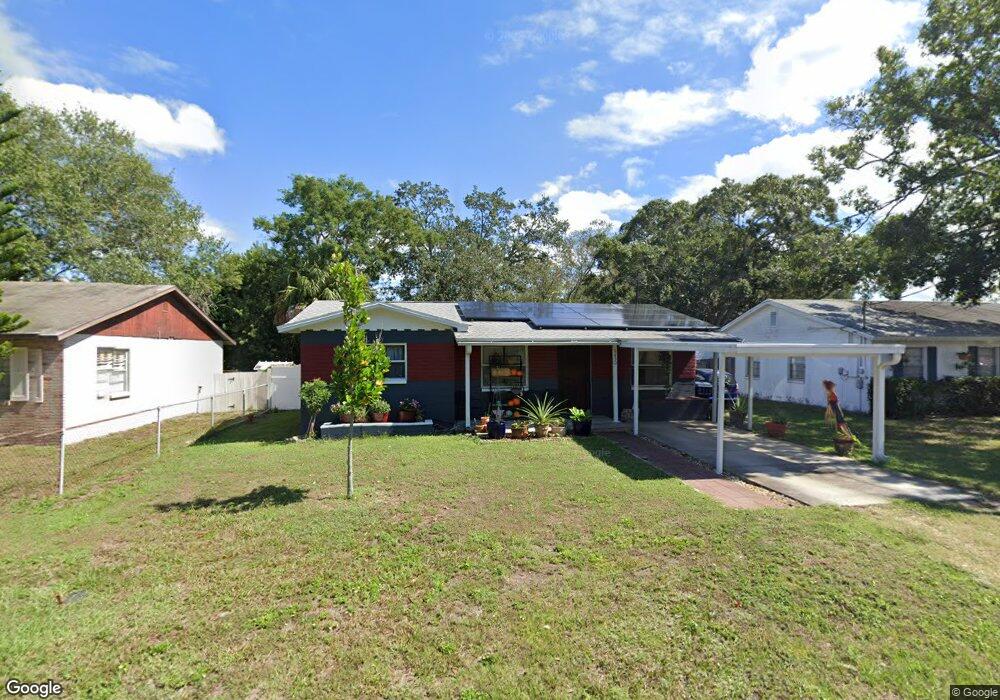
6230 S Adelia Ave Tampa, FL 33616
Sun Bay South NeighborhoodEstimated Value: $299,000 - $323,000
2
Beds
2
Baths
1,530
Sq Ft
$204/Sq Ft
Est. Value
About This Home
This home is located at 6230 S Adelia Ave, Tampa, FL 33616 and is currently estimated at $311,608, approximately $203 per square foot. 6230 S Adelia Ave is a home located in Hillsborough County with nearby schools including Lanier Elementary School, Monroe Middle School, and Robinson High School.
Ownership History
Date
Name
Owned For
Owner Type
Purchase Details
Closed on
Sep 22, 2010
Sold by
Leaf Mark
Bought by
Wilson Thomas M and Wilson Dawnlee A
Current Estimated Value
Home Financials for this Owner
Home Financials are based on the most recent Mortgage that was taken out on this home.
Original Mortgage
$94,724
Outstanding Balance
$62,327
Interest Rate
4.37%
Mortgage Type
FHA
Estimated Equity
$249,281
Purchase Details
Closed on
Aug 3, 2007
Sold by
Moore Carol A and Shea Carol A
Bought by
Leaf Mark
Home Financials for this Owner
Home Financials are based on the most recent Mortgage that was taken out on this home.
Original Mortgage
$131,560
Interest Rate
6.63%
Mortgage Type
Unknown
Purchase Details
Closed on
Jan 14, 2002
Sold by
Sones Jeanne A
Bought by
Sones Donald R
Purchase Details
Closed on
Jul 10, 2001
Sold by
Sones Donald R
Bought by
Sones Donald R and Sones Jeanne A
Purchase Details
Closed on
May 17, 2001
Sold by
Sones Jeanne A
Bought by
Sones Donald R
Create a Home Valuation Report for This Property
The Home Valuation Report is an in-depth analysis detailing your home's value as well as a comparison with similar homes in the area
Home Values in the Area
Average Home Value in this Area
Purchase History
| Date | Buyer | Sale Price | Title Company |
|---|---|---|---|
| Wilson Thomas M | $96,000 | Majesty Title Services Llc | |
| Leaf Mark | $164,500 | Accu Title Agency | |
| Sones Donald R | -- | -- | |
| Sones Donald R | $11,500 | -- | |
| Sones Donald R | $12,000 | -- |
Source: Public Records
Mortgage History
| Date | Status | Borrower | Loan Amount |
|---|---|---|---|
| Open | Wilson Thomas M | $94,724 | |
| Previous Owner | Leaf Mark | $131,560 |
Source: Public Records
Tax History Compared to Growth
Tax History
| Year | Tax Paid | Tax Assessment Tax Assessment Total Assessment is a certain percentage of the fair market value that is determined by local assessors to be the total taxable value of land and additions on the property. | Land | Improvement |
|---|---|---|---|---|
| 2024 | $727 | $64,802 | -- | -- |
| 2023 | $721 | $62,915 | $0 | $0 |
| 2022 | $715 | $61,083 | $0 | $0 |
| 2021 | $719 | $59,304 | $0 | $0 |
| 2020 | $712 | $58,485 | $0 | $0 |
| 2019 | $698 | $57,170 | $0 | $0 |
| 2018 | $691 | $56,104 | $0 | $0 |
| 2017 | $681 | $100,293 | $0 | $0 |
| 2016 | $651 | $51,887 | $0 | $0 |
| 2015 | $613 | $51,526 | $0 | $0 |
| 2014 | $567 | $51,117 | $0 | $0 |
| 2013 | -- | $50,362 | $0 | $0 |
Source: Public Records
Map
Nearby Homes
- 6211 S Harold Ave
- 6209 S Harold Ave
- 6208 S Harold Ave
- 6321 S Richard Ave
- 4008 W Olive St
- 6206 S Adelia Ave
- 3902 W Elrod Ave
- 4101 W Mango Ave
- 4016 W Montgomery Terrace
- 3717 Anchor Dr
- 3732 Yardarm Dr
- 3738 Binnacle Dr
- 6425 S Adelia Ave
- 3729 Yardarm Dr
- 3727 Yardarm Dr
- 6703 Interbay Blvd
- 3732 Binnacle Dr
- 3728 Winward Lakes Dr
- 4114 W Olive St
- 6203 Starboard Ln
- 6232 S Adelia Ave
- 6227 S Church Ave
- 6236 S Adelia Ave
- 6226 S Adelia Ave
- 6231 S Church Ave
- 6229 S Adelia Ave
- 6231 S Adelia Ave
- 6225 S Church Ave
- 6227 S Adelia Ave
- 6233 S Adelia Ave
- 6238 S Adelia Ave
- 6224 S Adelia Ave
- 3901 W Mango Ave
- 6225 S Adelia Ave
- 6223 S Church Ave
- 6223 S Adelia Ave
- 6235 S Adelia Ave
- 6301 S Adelia Ave
- 6208 S Richard Ave
- 6230 S Church Ave