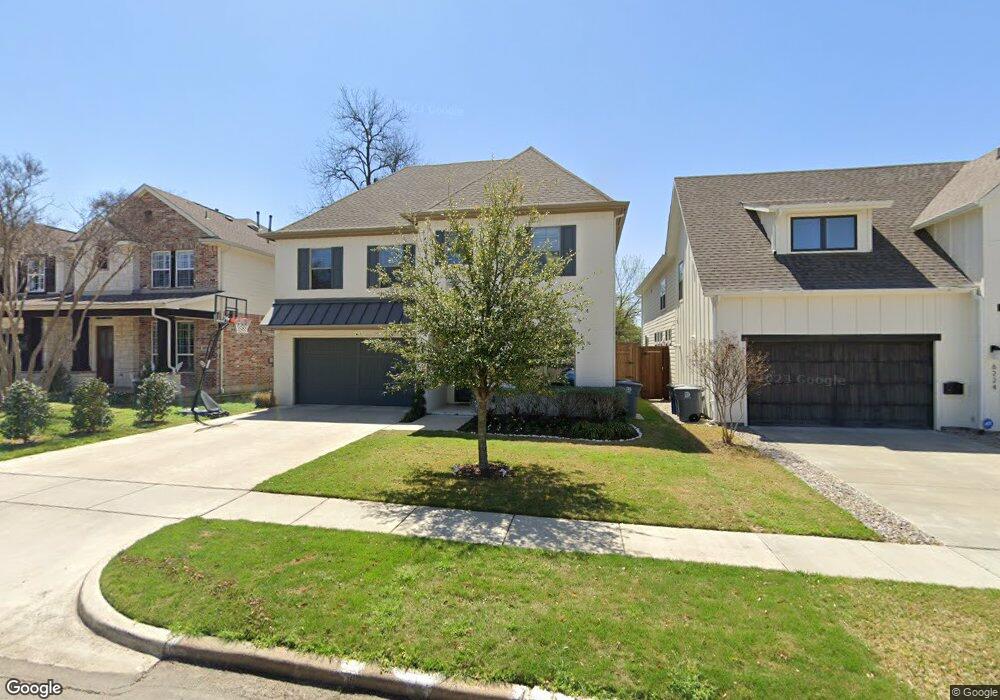
6230 Velasco Ave Dallas, TX 75214
Lakewood NeighborhoodEstimated Value: $1,564,000 - $1,656,000
5
Beds
5
Baths
4,187
Sq Ft
$383/Sq Ft
Est. Value
About This Home
This home is located at 6230 Velasco Ave, Dallas, TX 75214 and is currently estimated at $1,601,928, approximately $382 per square foot. 6230 Velasco Ave is a home located in Dallas County with nearby schools including J L Long Middle School, Woodrow Wilson High School, and St Thomas Aquinas Catholic School.
Ownership History
Date
Name
Owned For
Owner Type
Purchase Details
Closed on
Mar 14, 2018
Sold by
Fisher Cecilia K
Bought by
Fisher Cecilia Kay and Cecilia Fisher Living Trust
Current Estimated Value
Purchase Details
Closed on
Aug 31, 2017
Sold by
Bch Development Llc
Bought by
Fisher Cecilia K and Fisher Cecilia
Home Financials for this Owner
Home Financials are based on the most recent Mortgage that was taken out on this home.
Original Mortgage
$450,000
Outstanding Balance
$369,029
Interest Rate
3.25%
Mortgage Type
Adjustable Rate Mortgage/ARM
Estimated Equity
$1,232,899
Purchase Details
Closed on
Jun 24, 2016
Sold by
Langford Benjamin and Langford Stephanie
Bought by
Bch Development Llc
Home Financials for this Owner
Home Financials are based on the most recent Mortgage that was taken out on this home.
Original Mortgage
$250,000
Interest Rate
3.57%
Mortgage Type
Commercial
Purchase Details
Closed on
Feb 26, 2016
Sold by
Moore Lisa Anne
Bought by
Langford Benjamin
Create a Home Valuation Report for This Property
The Home Valuation Report is an in-depth analysis detailing your home's value as well as a comparison with similar homes in the area
Home Values in the Area
Average Home Value in this Area
Purchase History
| Date | Buyer | Sale Price | Title Company |
|---|---|---|---|
| Fisher Cecilia Kay | -- | None Available | |
| Fisher Cecilia K | -- | Allegiance Title | |
| Bch Development Llc | -- | Allegiance Title | |
| Langford Benjamin | -- | Allegiance Title |
Source: Public Records
Mortgage History
| Date | Status | Borrower | Loan Amount |
|---|---|---|---|
| Open | Fisher Cecilia K | $450,000 | |
| Previous Owner | Bch Development Llc | $250,000 |
Source: Public Records
Tax History Compared to Growth
Tax History
| Year | Tax Paid | Tax Assessment Tax Assessment Total Assessment is a certain percentage of the fair market value that is determined by local assessors to be the total taxable value of land and additions on the property. | Land | Improvement |
|---|---|---|---|---|
| 2025 | $21,169 | $1,470,420 | $450,000 | $1,020,420 |
| 2024 | $21,169 | $1,413,140 | $450,000 | $963,140 |
| 2023 | $21,169 | $1,380,600 | $450,000 | $930,600 |
| 2022 | $29,949 | $1,197,790 | $300,000 | $897,790 |
| 2021 | $23,272 | $882,190 | $300,000 | $582,190 |
| 2020 | $24,805 | $914,330 | $262,500 | $651,830 |
| 2019 | $26,015 | $914,330 | $262,500 | $651,830 |
| 2018 | $25,286 | $929,920 | $262,500 | $667,420 |
| 2017 | $11,012 | $404,950 | $225,000 | $179,950 |
| 2016 | $8,702 | $320,000 | $225,000 | $95,000 |
| 2015 | $7,465 | $272,160 | $202,500 | $69,660 |
| 2014 | $7,465 | $272,160 | $202,500 | $69,660 |
Source: Public Records
Map
Nearby Homes
- 6235 Palo Pinto Ave
- 6215 Llano Ave
- 6211 Velasco Ave
- 6334 Velasco Ave
- 6339 Velasco Ave
- 6227 Lakeshore Dr
- 6159 Velasco Ave
- 6234 Lakeshore Dr
- 6145 Llano Ave
- 6218 Lakeshore Dr
- 6326 Lakeshore Dr
- 6254 Goliad Ave
- 6163 Vanderbilt Ave
- 6111 Palo Pinto Ave
- 6211 Marquita Ave
- 6035 Velasco Ave
- 6166 Belmont Ave
- 6038 Goodwin Ave
- 6329 Richmond Ave
- 6333 Richmond Ave Unit D
- 6234 Velasco Ave
- 6224 Velasco Ave
- 6238 Velasco Ave
- 6220 Velasco Ave
- 6242 Velasco Ave
- 6218 Velasco Ave
- 6229 Palo Pinto Ave
- 6227 Palo Pinto Ave
- 6239 Palo Pinto Ave
- 6223 Palo Pinto Ave
- 6246 Velasco Ave
- 6231 Velasco Ave
- 6216 Velasco Ave
- 6233 Velasco Ave
- 6225 Velasco Ave
- 6243 Palo Pinto Ave
- 6219 Palo Pinto Ave
- 6239 Velasco Ave
- 6223 Velasco Ave
- 6243 Velasco Ave