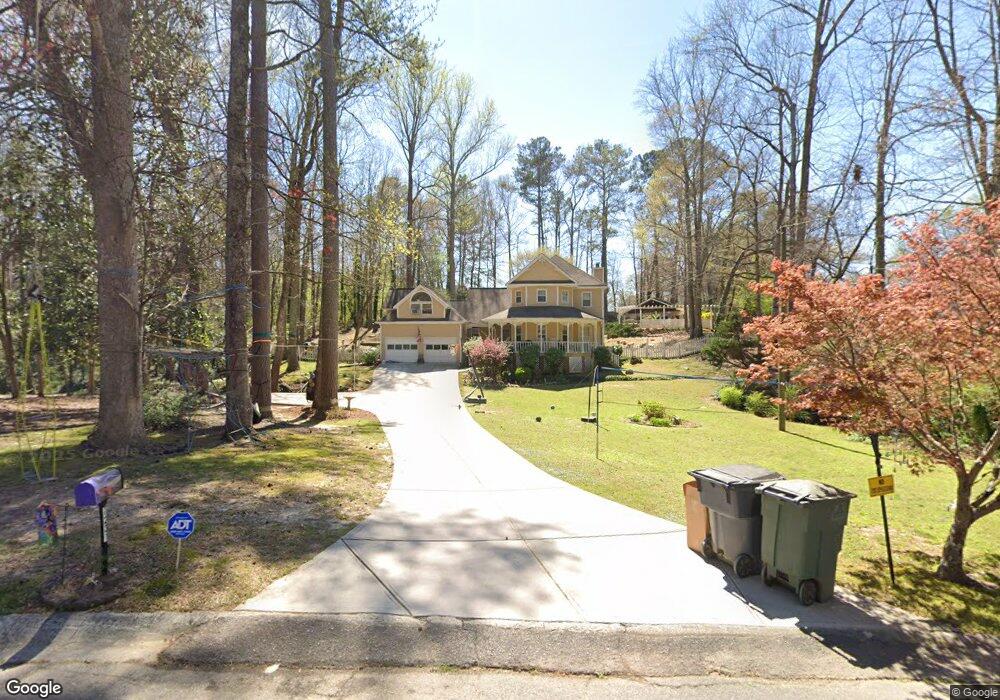
6231 Greenbrook Cir Austell, GA 30168
Estimated Value: $329,000 - $390,000
3
Beds
3
Baths
2,389
Sq Ft
$152/Sq Ft
Est. Value
About This Home
This home is located at 6231 Greenbrook Cir, Austell, GA 30168 and is currently estimated at $362,808, approximately $151 per square foot. 6231 Greenbrook Cir is a home located in Cobb County with nearby schools including Mableton Elementary School, Garrett Middle School, and Pebblebrook High School.
Ownership History
Date
Name
Owned For
Owner Type
Purchase Details
Closed on
May 12, 2005
Sold by
Muccitelli Michelle and Muccitelli Jonathan
Bought by
Chacona Casey
Current Estimated Value
Home Financials for this Owner
Home Financials are based on the most recent Mortgage that was taken out on this home.
Original Mortgage
$190,000
Outstanding Balance
$99,318
Interest Rate
5.98%
Mortgage Type
New Conventional
Estimated Equity
$263,490
Purchase Details
Closed on
Dec 6, 2004
Sold by
Peal Billy V
Bought by
Quimby Tiffany J
Home Financials for this Owner
Home Financials are based on the most recent Mortgage that was taken out on this home.
Original Mortgage
$25,850
Interest Rate
5.67%
Mortgage Type
Stand Alone Second
Purchase Details
Closed on
Aug 2, 1996
Sold by
Shirley Stephen S Alisha
Bought by
Wood Michelle M
Create a Home Valuation Report for This Property
The Home Valuation Report is an in-depth analysis detailing your home's value as well as a comparison with similar homes in the area
Home Values in the Area
Average Home Value in this Area
Purchase History
| Date | Buyer | Sale Price | Title Company |
|---|---|---|---|
| Chacona Casey | $191,200 | -- | |
| Quimby Tiffany J | $172,500 | -- | |
| Wood Michelle M | $108,000 | -- |
Source: Public Records
Mortgage History
| Date | Status | Borrower | Loan Amount |
|---|---|---|---|
| Open | Chacona Casey | $190,000 | |
| Previous Owner | Quimby Tiffany J | $25,850 | |
| Previous Owner | Quimby Tiffany J | $138,000 | |
| Closed | Wood Michelle M | $0 |
Source: Public Records
Tax History Compared to Growth
Tax History
| Year | Tax Paid | Tax Assessment Tax Assessment Total Assessment is a certain percentage of the fair market value that is determined by local assessors to be the total taxable value of land and additions on the property. | Land | Improvement |
|---|---|---|---|---|
| 2025 | $3,160 | $131,016 | $20,000 | $111,016 |
| 2024 | $3,162 | $131,016 | $20,000 | $111,016 |
| 2023 | $2,620 | $131,016 | $20,000 | $111,016 |
| 2022 | $2,365 | $93,464 | $14,000 | $79,464 |
| 2021 | $2,365 | $93,464 | $14,000 | $79,464 |
| 2020 | $2,365 | $93,464 | $14,000 | $79,464 |
| 2019 | $1,989 | $76,292 | $10,000 | $66,292 |
| 2018 | $1,989 | $76,292 | $10,000 | $66,292 |
| 2017 | $1,894 | $76,292 | $10,000 | $66,292 |
| 2016 | $1,789 | $71,468 | $6,000 | $65,468 |
| 2015 | $1,148 | $47,808 | $10,000 | $37,808 |
| 2014 | $1,158 | $47,808 | $0 | $0 |
Source: Public Records
Map
Nearby Homes
- 6445 Sherwood Trail
- 1550 Greenbrook Dr
- 1576 S Gordon Rd
- 1151 S Gordon Rd
- 6084 S Gordon Rd
- 6243 David Ln SW
- 1972 Cox Dr Unit 5
- 1794 Blossom Ln
- 1426 Thunderwood Ln SW
- 1784 Brandemere Dr Unit 3
- 2023 Lee Dr
- 1310 Dillon Rd
- 2072 Woodbine Cir
- 6651 Malvin Dr
- 1582 Pine Cir
- 6083 Oak Hill Dr
- 1628 Pendley Dr
- 6581 Coventry Point Unit 1
- 1397 Jewell Ct SW
- 6718 Roscommon Dr
- 6221 Greenbrook Cir Unit 3
- 6241 Greenbrook Cir
- 6240 Greenbrook Cir
- 6211 Greenbrook Cir
- 6210 Greenbrook Cir
- 1698 Creveis Rd
- 1696 Greenbrook Dr
- 6201 Greenbrook Cir
- 1706 Greenbrook Dr
- 1677 Greenbrook Dr
- 6311 Mark Trail
- 1694 Creveis Rd
- 1712 Creveis Rd
- 6200 Greenbrook Cir
- 1730 Creveis Rd
- 6191 Greenbrook Cir
- 1740 Creveis Rd
- 6321 Mark Trail Unit 7
- 6321 Mark Trail
- 1686 Greenbrook Dr