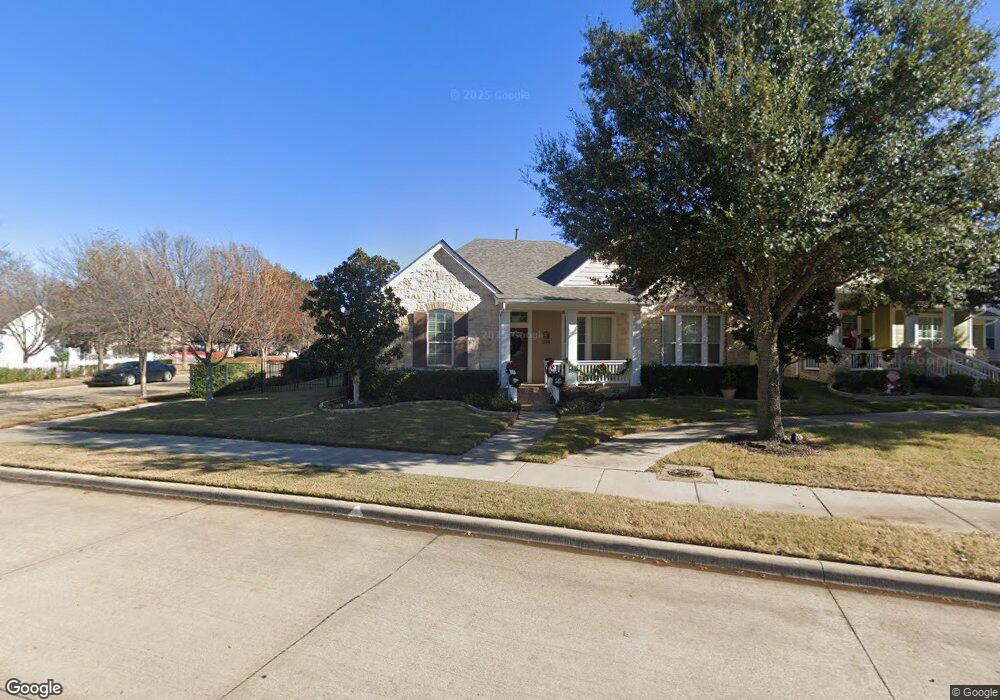
6232 Sherbert Dr North Richland Hills, TX 76180
Estimated Value: $493,000 - $582,000
3
Beds
2
Baths
2,553
Sq Ft
$209/Sq Ft
Est. Value
About This Home
This home is located at 6232 Sherbert Dr, North Richland Hills, TX 76180 and is currently estimated at $533,789, approximately $209 per square foot. 6232 Sherbert Dr is a home located in Tarrant County with nearby schools including Walker Creek Elementary School, Smithfield Middle School, and Birdville High School.
Ownership History
Date
Name
Owned For
Owner Type
Purchase Details
Closed on
Mar 28, 2008
Sold by
Weekley Homes Lp
Bought by
Ballard Edward C and Ballard Sylvia S
Current Estimated Value
Home Financials for this Owner
Home Financials are based on the most recent Mortgage that was taken out on this home.
Original Mortgage
$261,250
Outstanding Balance
$163,321
Interest Rate
5.72%
Mortgage Type
Unknown
Estimated Equity
$370,468
Purchase Details
Closed on
Sep 19, 2007
Sold by
Arcadia Land Partners 16 Ltd
Bought by
Weekley Homes Lp
Home Financials for this Owner
Home Financials are based on the most recent Mortgage that was taken out on this home.
Original Mortgage
$125,000
Interest Rate
6.66%
Mortgage Type
Construction
Create a Home Valuation Report for This Property
The Home Valuation Report is an in-depth analysis detailing your home's value as well as a comparison with similar homes in the area
Home Values in the Area
Average Home Value in this Area
Purchase History
| Date | Buyer | Sale Price | Title Company |
|---|---|---|---|
| Ballard Edward C | $326,622 | None Available | |
| Weekley Homes Lp | -- | Priority Title Co |
Source: Public Records
Mortgage History
| Date | Status | Borrower | Loan Amount |
|---|---|---|---|
| Open | Ballard Edward C | $261,250 | |
| Previous Owner | Weekley Homes Lp | $125,000 |
Source: Public Records
Tax History Compared to Growth
Tax History
| Year | Tax Paid | Tax Assessment Tax Assessment Total Assessment is a certain percentage of the fair market value that is determined by local assessors to be the total taxable value of land and additions on the property. | Land | Improvement |
|---|---|---|---|---|
| 2025 | $3,409 | $482,290 | $73,355 | $408,935 |
| 2024 | $3,409 | $571,389 | $73,355 | $498,034 |
| 2023 | $10,444 | $533,000 | $73,355 | $459,645 |
| 2022 | $10,415 | $482,194 | $73,355 | $408,839 |
| 2021 | $10,012 | $393,466 | $75,000 | $318,466 |
| 2020 | $9,792 | $384,810 | $75,000 | $309,810 |
| 2019 | $10,529 | $399,814 | $75,000 | $324,814 |
| 2018 | $5,693 | $366,512 | $75,000 | $291,512 |
| 2017 | $9,567 | $378,156 | $75,000 | $303,156 |
| 2016 | $8,697 | $323,246 | $40,000 | $283,246 |
| 2015 | $5,726 | $324,700 | $40,000 | $284,700 |
| 2014 | $5,726 | $324,700 | $40,000 | $284,700 |
Source: Public Records
Map
Nearby Homes
- 6113 Cliffbrook Dr
- 6250 Shirley Dr
- 8020 Bridge St
- 8057 Caladium Dr
- 6017 Avalon St
- 8240 Bridge St
- 8321 Bridge St
- 5920 Pedernales Ridge
- 7800 Mockingbird Ln Unit 29
- 7800 Mockingbird Ln Unit 81
- 7800 Mockingbird Ln Unit 73
- 7800 Mockingbird Ln Unit 43
- 7800 Mockingbird Ln Unit 205
- 0 Mid Cities Blvd
- 6137 Marquita Mews
- 6116 Morningside Dr
- 7713 Deaver Dr
- 7696 Resting Mews Ln
- 7704 Terry Dr
- 8740 Ice House Dr
- 6228 Sherbert Dr
- 6236 Sherbert Dr
- 6224 Sherbert Dr
- 6240 Sherbert Dr
- 6145 Pleasant Dream St
- 6244 Sherbert Dr
- 6141 Pleasant Dream St
- 6241 Sherbert Dr
- 6137 Pleasant Dream St
- 6220 Sherbert Dr
- 6201 Shirley Dr
- 6248 Sherbert Dr
- 6252 Sherbert Dr
- 6237 Sherbert Dr
- 6205 Shirley Dr
- 6129 Pleasant Dream St
- 6256 Sherbert Dr
- 8072 Caladium Dr
- 8068 Caladium Dr
- 6260 Sherbert Dr