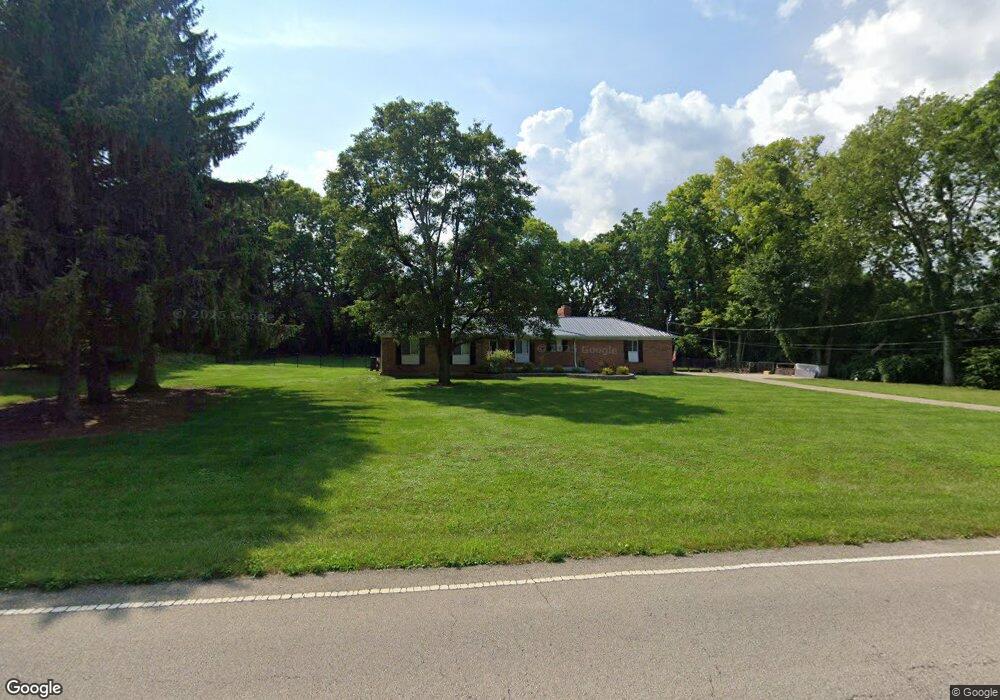
6233 Red Lion 5 Points Rd Springboro, OH 45066
Estimated Value: $361,000 - $427,000
3
Beds
3
Baths
1,638
Sq Ft
$235/Sq Ft
Est. Value
About This Home
This home is located at 6233 Red Lion 5 Points Rd, Springboro, OH 45066 and is currently estimated at $384,734, approximately $234 per square foot. 6233 Red Lion 5 Points Rd is a home located in Warren County with nearby schools including Clearcreek Elementary School, Dennis Elementary School, and Springboro Intermediate School.
Ownership History
Date
Name
Owned For
Owner Type
Purchase Details
Closed on
Mar 5, 2018
Sold by
Moore Brandson S and Moore Miranda L
Bought by
Bray Edward R
Current Estimated Value
Home Financials for this Owner
Home Financials are based on the most recent Mortgage that was taken out on this home.
Original Mortgage
$176,739
Outstanding Balance
$150,982
Interest Rate
4.25%
Mortgage Type
FHA
Estimated Equity
$233,752
Purchase Details
Closed on
Mar 16, 2017
Sold by
Moore Brandon S
Bought by
Bray Edward R and Bray B
Home Financials for this Owner
Home Financials are based on the most recent Mortgage that was taken out on this home.
Interest Rate
4.3%
Purchase Details
Closed on
Sep 19, 1984
Sold by
Powers Gary E and Powers Valerie
Bought by
Hixon and Hixon Oris
Create a Home Valuation Report for This Property
The Home Valuation Report is an in-depth analysis detailing your home's value as well as a comparison with similar homes in the area
Home Values in the Area
Average Home Value in this Area
Purchase History
| Date | Buyer | Sale Price | Title Company |
|---|---|---|---|
| Bray Edward R | -- | None Available | |
| Bray Edward R | $180,000 | -- | |
| Hixon | $10,000 | -- |
Source: Public Records
Mortgage History
| Date | Status | Borrower | Loan Amount |
|---|---|---|---|
| Open | Bray Edward R | $176,739 | |
| Previous Owner | Bray Edward R | -- |
Source: Public Records
Tax History Compared to Growth
Tax History
| Year | Tax Paid | Tax Assessment Tax Assessment Total Assessment is a certain percentage of the fair market value that is determined by local assessors to be the total taxable value of land and additions on the property. | Land | Improvement |
|---|---|---|---|---|
| 2024 | $3,769 | $96,370 | $23,210 | $73,160 |
| 2023 | $3,352 | $79,737 | $12,988 | $66,748 |
| 2022 | $3,352 | $79,737 | $12,989 | $66,749 |
| 2021 | $3,120 | $79,737 | $12,989 | $66,749 |
| 2020 | $2,902 | $64,827 | $10,560 | $54,268 |
| 2019 | $2,451 | $59,507 | $10,560 | $48,948 |
| 2018 | $2,521 | $59,507 | $10,560 | $48,948 |
| 2017 | $2,526 | $53,708 | $9,681 | $44,027 |
| 2016 | $2,563 | $53,708 | $9,681 | $44,027 |
| 2015 | $2,150 | $53,708 | $9,681 | $44,027 |
| 2014 | -- | $48,390 | $8,730 | $39,660 |
| 2013 | $1,999 | $58,540 | $10,550 | $47,990 |
Source: Public Records
Map
Nearby Homes
- 595 Heatherwoode Cir
- 75 Merritt Pass
- 44 Dunnington Ct
- 5944 Round Hill Ct
- Hampton Plan at Northampton
- 55 Glasgow St Unit 37
- 65 Morris St Unit 17
- 130 Morris St Unit 8
- 70 Morris St Unit 6
- 130 Morris St
- 65 Morris St
- 70 Morris St
- Cooke Plan at Northampton
- Barrett Plan at Northampton
- 45 Morris St
- 25 Morris St
- 30 Morris St
- 50 Morris St
- 35 Morris St
- Melville Plan at Northampton
- 6265 Red Lion 5 Points Rd
- 80 Balcomie Way
- 6265 Red Lion-Five Points Rd
- 6264 Red Lion 5 Points Rd
- 615 Heatherwoode Cir
- 625 Heatherwoode Cir
- 10 Balcomie Way
- 15 Nairn Ct
- 6244 Red Lion 5 Points Rd
- 635 Heatherwoode Cir
- 6276 Red Lion 5 Points Rd
- 6200 Red Lion 5 Points Rd
- 610 Heatherwoode Cir
- 620 Heatherwoode Cir
- 20 Nairn Ct
- 592 Heatherwoode Cir
- 630 Heatherwoode Cir
- 6300 Red Lion 5 Points Rd
- 15 Balcomie Way
- 10 Nairn Ct