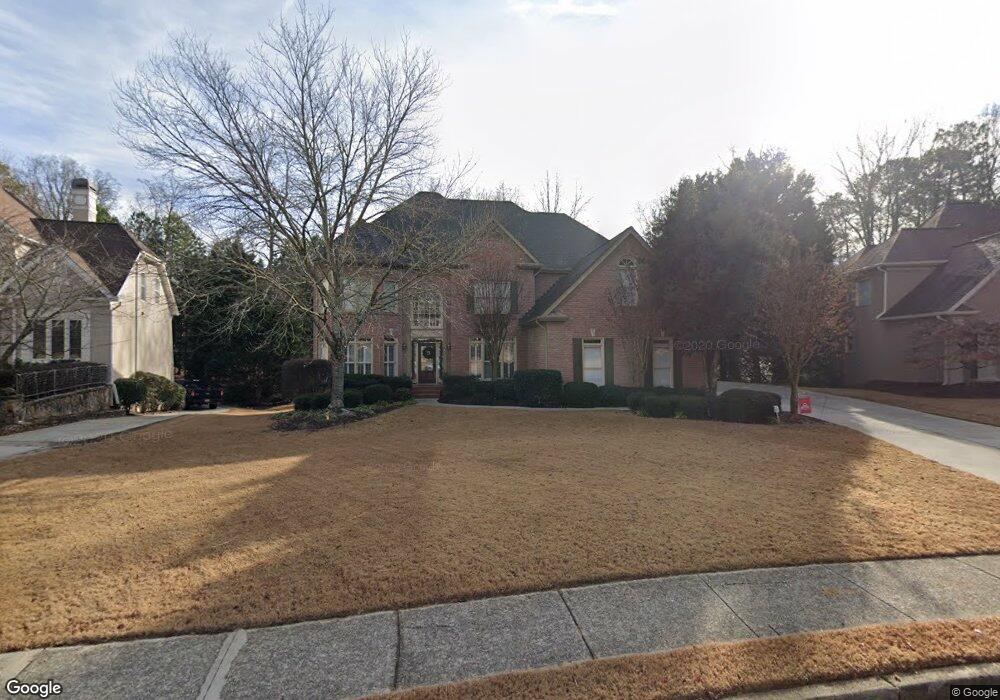
6235 Deerwoods Trail Unit III Alpharetta, GA 30005
Estimated Value: $905,000 - $1,056,000
5
Beds
5
Baths
3,003
Sq Ft
$321/Sq Ft
Est. Value
About This Home
This home is located at 6235 Deerwoods Trail Unit III, Alpharetta, GA 30005 and is currently estimated at $962,605, approximately $320 per square foot. 6235 Deerwoods Trail Unit III is a home located in Forsyth County with nearby schools including Brookwood Elementary School, South Forsyth Middle School, and Lambert High School.
Ownership History
Date
Name
Owned For
Owner Type
Purchase Details
Closed on
Jun 30, 2000
Sold by
Williamson Mark S and Williamson Tracy S
Bought by
Reighard Bruce E and Reighard Shirley
Current Estimated Value
Home Financials for this Owner
Home Financials are based on the most recent Mortgage that was taken out on this home.
Original Mortgage
$270,000
Outstanding Balance
$98,735
Interest Rate
8.54%
Mortgage Type
New Conventional
Estimated Equity
$863,870
Purchase Details
Closed on
Aug 8, 1997
Sold by
Hlava Edward C and Hlava Sharon C
Bought by
Moran Julie A and Moran Larry P
Home Financials for this Owner
Home Financials are based on the most recent Mortgage that was taken out on this home.
Original Mortgage
$301,000
Interest Rate
8%
Mortgage Type
New Conventional
Purchase Details
Closed on
Mar 29, 1996
Sold by
Kathleen Day Associates Inc
Bought by
Hlava Edward Sharon
Create a Home Valuation Report for This Property
The Home Valuation Report is an in-depth analysis detailing your home's value as well as a comparison with similar homes in the area
Home Values in the Area
Average Home Value in this Area
Purchase History
| Date | Buyer | Sale Price | Title Company |
|---|---|---|---|
| Reighard Bruce E | $252,500 | -- | |
| Moran Julie A | $301,000 | -- | |
| Hlava Edward Sharon | $273,000 | -- |
Source: Public Records
Mortgage History
| Date | Status | Borrower | Loan Amount |
|---|---|---|---|
| Open | Reighard Bruce E | $270,000 | |
| Previous Owner | Moran Julie A | $301,000 | |
| Closed | Hlava Edward Sharon | $0 |
Source: Public Records
Tax History Compared to Growth
Tax History
| Year | Tax Paid | Tax Assessment Tax Assessment Total Assessment is a certain percentage of the fair market value that is determined by local assessors to be the total taxable value of land and additions on the property. | Land | Improvement |
|---|---|---|---|---|
| 2025 | $969 | $376,416 | $78,000 | $298,416 |
| 2024 | $969 | $317,928 | $68,000 | $249,928 |
| 2023 | $5,832 | $312,792 | $60,000 | $252,792 |
| 2022 | $5,601 | $205,620 | $50,000 | $155,620 |
| 2021 | $4,954 | $205,620 | $50,000 | $155,620 |
| 2020 | $4,815 | $198,848 | $50,000 | $148,848 |
| 2019 | $4,761 | $195,872 | $50,000 | $145,872 |
| 2018 | $4,741 | $193,456 | $50,000 | $143,456 |
| 2017 | $4,525 | $182,316 | $40,000 | $142,316 |
| 2016 | $4,314 | $172,316 | $30,000 | $142,316 |
| 2015 | $4,322 | $172,316 | $30,000 | $142,316 |
| 2014 | $3,572 | $146,304 | $0 | $0 |
Source: Public Records
Map
Nearby Homes
- 4130 Millbrook Ct
- 3845 Bridle Creek Dr
- 3820 Ridge Point Dr
- 5105 Deerlake Dr
- 3415 Fox Hollow Way
- 4020 Bridle Ridge Dr
- 7260 Fawn Lake Dr
- 4165 Hammond Bridge Dr
- 4150 Cedar Bridge Walk
- 3730 Lakeheath Dr
- 7335 Lytham Trace
- 7170 Collingsworth Place
- 3715 Lakeheath Dr
- 7045 Harlech Trace
- 3150 Thistle Trail
- 3585 Lakeheath Dr
- 3910 Dalwood Dr
- 11800 Carriage Park Ln
- 7530 Newstead Dr
- 595 Barsham Way
- 6245 Deerwoods Trail Unit III
- 6225 Deerwoods Trail
- 6215 Deerwoods Trail Unit III
- 6255 Deerwoods Trail
- 6200 Deerwoods Trail Unit III
- 305 Antler Way
- 5405 Buck Hollow Dr
- 6205 Deerwoods Trail
- 6210 Deerwoods Trail
- 180 Antler Trail Unit I
- 315 Antler Way
- 4150 Millbrook Ct
- 5415 Buck Hollow Dr
- 6195 Deerwoods Trail
- 4140 Millbrook Ct
- 6275 Deerwoods Trail
- 3955 Shiloh Ridge Run
- 6260 Deerwoods Trail
- 4160 Millbrook Ct
- 4110 Millbrook Ct