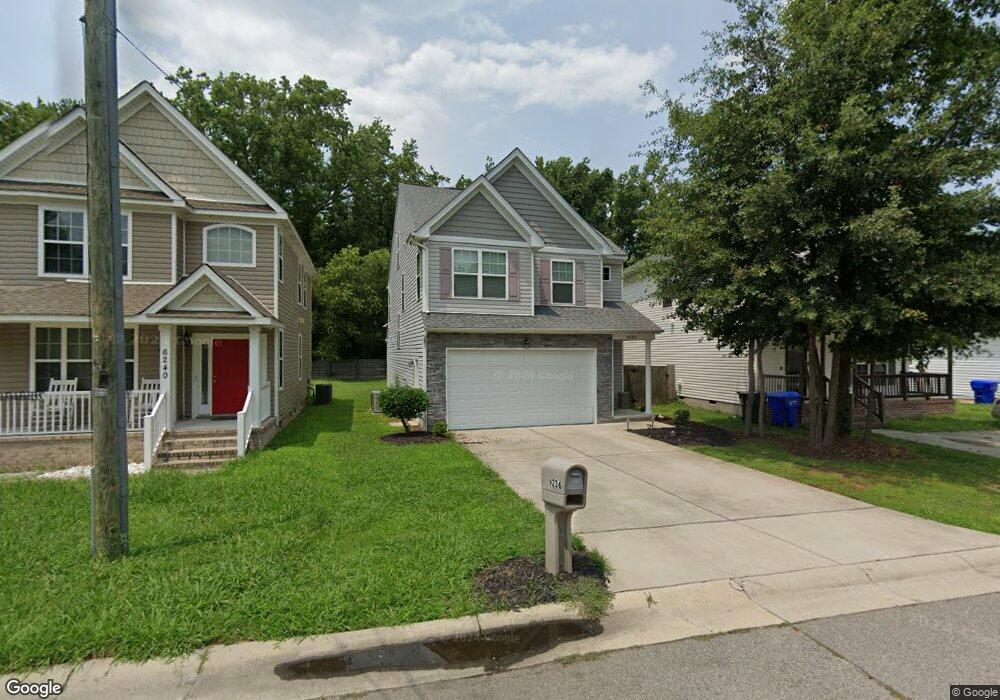
6236 Freeman Ave Suffolk, VA 23435
Nansemond NeighborhoodEstimated Value: $407,000 - $425,000
5
Beds
4
Baths
2,325
Sq Ft
$179/Sq Ft
Est. Value
About This Home
This home is located at 6236 Freeman Ave, Suffolk, VA 23435 and is currently estimated at $416,635, approximately $179 per square foot. 6236 Freeman Ave is a home located in Suffolk City with nearby schools including Creekside Elementary School, John Yeates Middle School, and Nansemond River High School.
Ownership History
Date
Name
Owned For
Owner Type
Purchase Details
Closed on
Jan 23, 2018
Sold by
The Secretary Of Veterans Affairs An Off
Bought by
Sellers Corlis Lasley
Current Estimated Value
Purchase Details
Closed on
Oct 20, 2017
Sold by
Alg Trustee Llc A Virginia Limited Liabi and Lejkowski Heather L
Bought by
The Secretary Of Veterans Affairs An Off
Purchase Details
Closed on
May 8, 2015
Sold by
Hampton Roads Holding Co Llc
Bought by
Lejkowski Kenneth F
Home Financials for this Owner
Home Financials are based on the most recent Mortgage that was taken out on this home.
Original Mortgage
$275,702
Interest Rate
3.69%
Mortgage Type
VA
Purchase Details
Closed on
Sep 30, 2014
Sold by
Matthews Dellavisia X
Bought by
Hampton Roads Holding Company
Home Financials for this Owner
Home Financials are based on the most recent Mortgage that was taken out on this home.
Original Mortgage
$181,870
Interest Rate
4.12%
Mortgage Type
Land Contract Argmt. Of Sale
Create a Home Valuation Report for This Property
The Home Valuation Report is an in-depth analysis detailing your home's value as well as a comparison with similar homes in the area
Home Values in the Area
Average Home Value in this Area
Purchase History
| Date | Buyer | Sale Price | Title Company |
|---|---|---|---|
| Sellers Corlis Lasley | $225,000 | None Available | |
| The Secretary Of Veterans Affairs An Off | $222,733 | None Available | |
| Lejkowski Kenneth F | $269,900 | -- | |
| Hampton Roads Holding Company | $20,000 | -- |
Source: Public Records
Mortgage History
| Date | Status | Borrower | Loan Amount |
|---|---|---|---|
| Previous Owner | Hampton Roads Holding Company | $275,702 | |
| Previous Owner | Hampton Roads Holding Company | $181,870 |
Source: Public Records
Tax History
| Year | Tax Paid | Tax Assessment Tax Assessment Total Assessment is a certain percentage of the fair market value that is determined by local assessors to be the total taxable value of land and additions on the property. | Land | Improvement |
|---|---|---|---|---|
| 2025 | $4,878 | $413,800 | $49,100 | $364,700 |
| 2024 | $4,878 | $399,100 | $49,100 | $350,000 |
| 2023 | $4,663 | $331,800 | $49,100 | $282,700 |
| 2022 | $3,200 | $293,600 | $49,100 | $244,500 |
| 2021 | $3,105 | $279,700 | $46,800 | $232,900 |
| 2020 | $2,988 | $269,200 | $46,800 | $222,400 |
| 2019 | $2,706 | $243,800 | $26,700 | $217,100 |
| 2018 | $2,707 | $239,500 | $26,700 | $212,800 |
| 2017 | $2,563 | $239,500 | $26,700 | $212,800 |
| 2016 | $2,563 | $239,500 | $26,700 | $212,800 |
| 2015 | $130 | $232,200 | $26,700 | $205,500 |
| 2014 | $130 | $26,700 | $26,700 | $0 |
Source: Public Records
Map
Nearby Homes
- 6232 Old Townpoint Rd
- 6309 Freeman Ave
- 6336 Old Townpoint Rd
- 6340 Old Townpoint Rd
- 6354 Old Townpoint Rd
- 1103 Elaina Place
- 2071 Asher (Lot 11) Dr
- 2069 Asher (Lot 10) Dr
- 2057 Asher (Lot 4) Dr
- 5407 Sports Club Run
- 3001 Hogan Way
- 4025 Palmer Ct
- 2062 Nicklaus Dr
- 2064 Nicklaus Dr
- 5305 Sports Club Run Unit 403
- 1009 Nicklaus Dr
- 5322 Marsh Landing Ln
- 1008 Ashworth Way
- 1014 Ashworth Way
- 2002 Ashworth Way
- 6232 Freeman Ave
- 6240 Freeman Ave
- 6228 Freeman Ave
- 6232 Skeet Rd
- 6237 Freeman Ave
- 6241 Freeman Ave
- 6230 Skeet Rd
- 6233 Freeman Ave
- 6245 Freeman Ave
- 6220 Freeman Ave
- 6216 Freeman Ave
- 6221 Freeman Ave
- 6220 Skeet Rd
- 6240 Skeet Rd
- 6218 Freeman Ave
- 6214 Freeman Ave
- 6242 Skeet Rd
- 6219 Freeman Ave
- 6216 Skeet Rd
- 6213 Freeman Ave
Your Personal Tour Guide
Ask me questions while you tour the home.