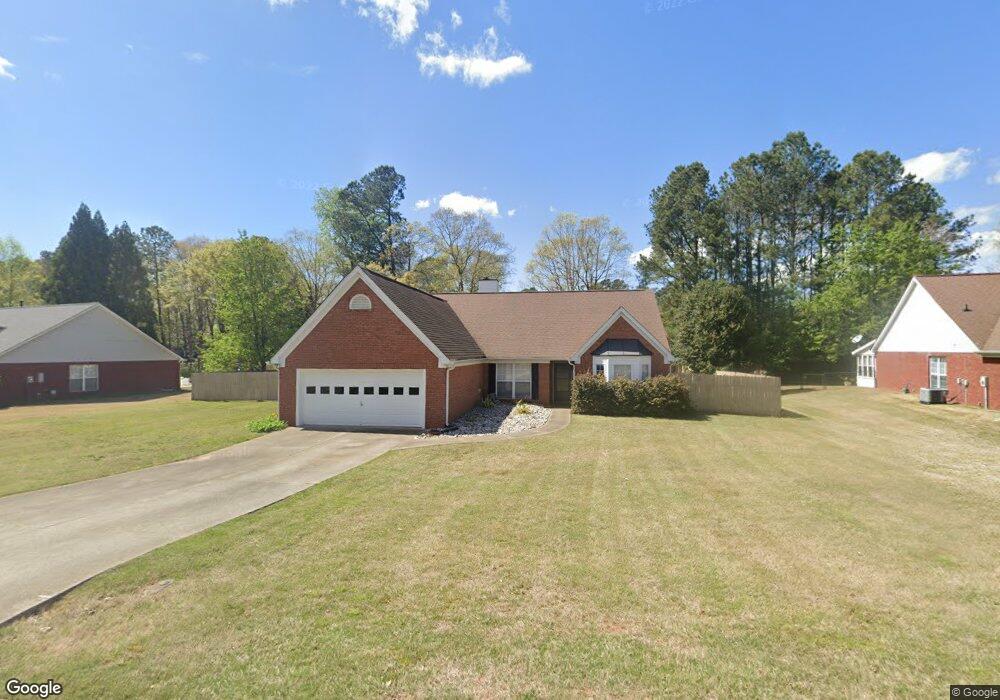
6237 Rock Port Dr Flowery Branch, GA 30542
Estimated Value: $398,569 - $462,000
3
Beds
2
Baths
2,046
Sq Ft
$213/Sq Ft
Est. Value
About This Home
This home is located at 6237 Rock Port Dr, Flowery Branch, GA 30542 and is currently estimated at $435,142, approximately $212 per square foot. 6237 Rock Port Dr is a home located in Hall County with nearby schools including Flowery Branch Elementary School, West Hall Middle School, and West Hall High School.
Ownership History
Date
Name
Owned For
Owner Type
Purchase Details
Closed on
Mar 11, 2011
Sold by
Federal Home Loan Mortgage Corporation
Bought by
Crump Hoyt W and Crump Laura
Current Estimated Value
Home Financials for this Owner
Home Financials are based on the most recent Mortgage that was taken out on this home.
Original Mortgage
$97,600
Outstanding Balance
$66,998
Interest Rate
4.77%
Mortgage Type
New Conventional
Estimated Equity
$368,144
Purchase Details
Closed on
Nov 2, 2010
Sold by
Gmac Mtg Llc
Bought by
Federal Home Loan Mortgage Corporation
Purchase Details
Closed on
Nov 19, 1996
Sold by
Bowen Bowenconstr Co Inc
Bought by
Beaty Gordon Evelyn
Purchase Details
Closed on
Aug 1, 1996
Create a Home Valuation Report for This Property
The Home Valuation Report is an in-depth analysis detailing your home's value as well as a comparison with similar homes in the area
Home Values in the Area
Average Home Value in this Area
Purchase History
| Date | Buyer | Sale Price | Title Company |
|---|---|---|---|
| Crump Hoyt W | -- | -- | |
| Federal Home Loan Mortgage Corporation | -- | -- | |
| Gmac Mtg Llc | $110,899 | -- | |
| Beaty Gordon Evelyn | $125,900 | -- | |
| -- | $39,600 | -- |
Source: Public Records
Mortgage History
| Date | Status | Borrower | Loan Amount |
|---|---|---|---|
| Open | Crump Hoyt W | $97,600 | |
| Closed | Beaty Gordon Evelyn | $0 |
Source: Public Records
Tax History Compared to Growth
Tax History
| Year | Tax Paid | Tax Assessment Tax Assessment Total Assessment is a certain percentage of the fair market value that is determined by local assessors to be the total taxable value of land and additions on the property. | Land | Improvement |
|---|---|---|---|---|
| 2024 | $4,070 | $161,936 | $27,200 | $134,736 |
| 2023 | $3,213 | $127,216 | $25,080 | $102,136 |
| 2022 | $3,021 | $114,536 | $25,080 | $89,456 |
| 2021 | $2,622 | $97,176 | $16,560 | $80,616 |
| 2020 | $2,447 | $87,856 | $11,480 | $76,376 |
| 2019 | $2,314 | $82,216 | $11,480 | $70,736 |
| 2018 | $2,201 | $75,536 | $11,480 | $64,056 |
| 2017 | $2,136 | $74,016 | $11,480 | $62,536 |
| 2016 | $1,928 | $68,216 | $11,480 | $56,736 |
| 2015 | $1,567 | $54,488 | $9,200 | $45,288 |
| 2014 | $1,567 | $54,488 | $9,200 | $45,288 |
Source: Public Records
Map
Nearby Homes
- 6228 Rock Port Dr
- 6284 Brookridge Dr
- 6121 Stillwater Trail
- 6241 Brookridge Dr
- 6354 Brookridge Dr
- 6201 Southport Dr
- 6306 Water Haven Way
- 6237 Stillwater Place
- 6225 S Port Dr
- 5388 Frazer Rd
- 6103 Portsmouth Dr
- 5904 Clipper Bay
- 6262 Laurel Wood Trail
- 4235 Crestwood Bend Cir
- 6104 Saddlehorse Dr
- 5220 Wild Cedar Dr
- 6233 Rock Port Dr
- 6241 Rock Port Dr
- 6227 Rock Port Dr
- 6075 Atlanta Hwy Unit 138 and 139
- 6075 Atlanta Hwy Unit 1
- 6075 Atlanta Hwy
- 6245 Rock Port Dr
- 6236 Rock Port Dr
- 6223 Rock Port Dr
- 6250 Rock Port Dr
- 6069 Atlanta Hwy
- 6249 Rock Port Dr
- 6220 Rock Port Dr
- 6063 Atlanta Hwy
- 6063 Atlanta Hwy
- 6264 Rock Port Dr
- 6214 Rock Port Dr
- 6257 Rock Port Dr
- 6076 Atlanta Hwy
- 6082 Atlanta Hwy