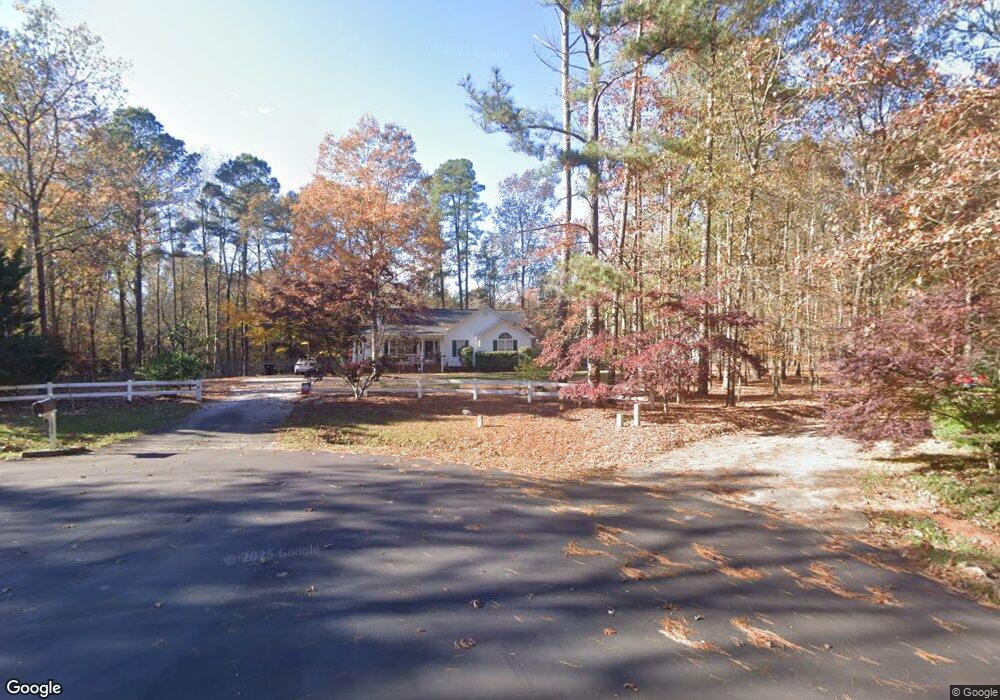
624 Bayleaf Cir Clayton, NC 27527
Estimated Value: $319,000 - $678,000
3
Beds
2
Baths
1,396
Sq Ft
$295/Sq Ft
Est. Value
About This Home
This home is located at 624 Bayleaf Cir, Clayton, NC 27527 and is currently estimated at $411,756, approximately $294 per square foot. 624 Bayleaf Cir is a home located in Johnston County with nearby schools including Archer Lodge Middle School, Corinth Holders High School, and Thales Academy at Flowers Plantation PreK-7.
Ownership History
Date
Name
Owned For
Owner Type
Purchase Details
Closed on
Mar 17, 2021
Sold by
Mccollum Dannis Mark and Mccollum Tamara D
Bought by
Mccollum Tamara D
Current Estimated Value
Home Financials for this Owner
Home Financials are based on the most recent Mortgage that was taken out on this home.
Original Mortgage
$173,382
Outstanding Balance
$155,425
Interest Rate
2.7%
Mortgage Type
FHA
Estimated Equity
$256,331
Purchase Details
Closed on
Sep 1, 2015
Sold by
Mccollum Dennis Mark and Mccollum Tamara D
Bought by
Mccollum Dennis Mark and Mccollum Tamara D
Purchase Details
Closed on
Jan 28, 2014
Sold by
Nationstar Mortgage Llc
Bought by
Mccollum Dennis Mark
Purchase Details
Closed on
Mar 31, 2006
Sold by
Coates Michael Troy and Coates Kimberly Suggs
Bought by
Olsen Bernard and Olsen Debra
Home Financials for this Owner
Home Financials are based on the most recent Mortgage that was taken out on this home.
Original Mortgage
$28,500
Interest Rate
6.2%
Mortgage Type
Stand Alone Second
Create a Home Valuation Report for This Property
The Home Valuation Report is an in-depth analysis detailing your home's value as well as a comparison with similar homes in the area
Home Values in the Area
Average Home Value in this Area
Purchase History
| Date | Buyer | Sale Price | Title Company |
|---|---|---|---|
| Mccollum Tamara D | -- | None Available | |
| Mccollum Dennis Mark | -- | None Available | |
| Mccollum Dennis Mark | $112,000 | None Available | |
| Olsen Bernard | $143,000 | None Available |
Source: Public Records
Mortgage History
| Date | Status | Borrower | Loan Amount |
|---|---|---|---|
| Open | Mccollum Tamara D | $173,382 | |
| Previous Owner | Olsen Bernard | $28,500 | |
| Previous Owner | Olsen Bernard | $114,000 |
Source: Public Records
Tax History
| Year | Tax Paid | Tax Assessment Tax Assessment Total Assessment is a certain percentage of the fair market value that is determined by local assessors to be the total taxable value of land and additions on the property. | Land | Improvement |
|---|---|---|---|---|
| 2025 | $1,901 | $299,330 | $85,000 | $214,330 |
| 2024 | $1,372 | $169,340 | $50,000 | $119,340 |
| 2023 | $1,372 | $169,340 | $50,000 | $119,340 |
| 2022 | $1,389 | $169,340 | $50,000 | $119,340 |
| 2021 | $1,389 | $169,340 | $50,000 | $119,340 |
| 2020 | $1,439 | $169,340 | $50,000 | $119,340 |
| 2019 | $1,439 | $169,340 | $50,000 | $119,340 |
| 2018 | $0 | $137,030 | $36,000 | $101,030 |
| 2017 | $1,192 | $137,030 | $36,000 | $101,030 |
| 2016 | $1,192 | $137,030 | $36,000 | $101,030 |
| 2015 | -- | $137,030 | $36,000 | $101,030 |
| 2014 | -- | $137,030 | $36,000 | $101,030 |
Source: Public Records
Map
Nearby Homes
- 115 SW Flowers Pkwy
- 191 SW Flowers Pkwy
- 195 Italia Ln
- 60 Stella Ct
- 176 Southwick Ave
- 110 Redbay Ln
- 90 Paraggi Ct
- 165 Naples Ln
- 232 Paraggi Ct
- 345 Siena Way
- 147 Antler Steel Dr
- 111 Antler Steel Dr
- 258 Blooming Willow Trail Unit 14
- 297 Diamante Dr
- 505 Whitley Ridge Dr
- 36 Hanging Moss Trail
- 224 Josiah Dr
- 136 Ogden Cir
- 13 E Milan Ct
- 174 Ogden Cir
- 615 Bayleaf Cir
- 620 Bayleaf Cir
- 616 Bayleaf Cir
- 613 Bayleaf Cir
- 664 Southwick Ave
- 660 Southwick Ave
- 612 Bayleaf Cir
- 668 Southwick Ave
- 620 Southwick Ave
- 608 Bayleaf Cir
- 533 Southmead Dr
- 128 Watson Cir
- 527 Southmead Dr
- 120 Watson Cir
- 132 Watson Cir
- 604 Bayleaf Cir
- 523 Southmead Dr
- 667 Southwick Ave
- 523 S Mead Dr
- 655 Southwick Ave
Your Personal Tour Guide
Ask me questions while you tour the home.