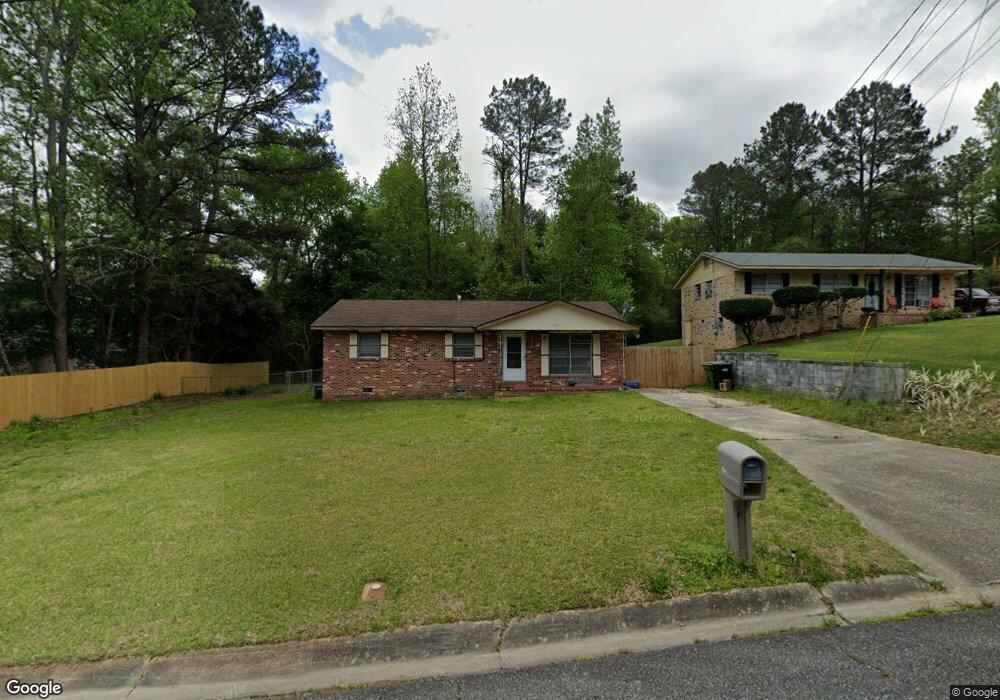
624 Beeman Ct Columbus, GA 31907
Estimated Value: $100,839 - $130,000
3
Beds
2
Baths
1,067
Sq Ft
$107/Sq Ft
Est. Value
About This Home
This is a beautiful home in a quiet cul-de-sac with a large, private, fenced-in back yard. It boasts three spacious bedrooms and one bathroom. The entry door opens into a large living area and flows into a large dining area and kitchen, which are newly renovated. A large pantry and washer/dryer room are easily accessible. This house is in a great neighborhood, is conveniently located off Buena Vista Avenue and is gas stove and water heater. This is a no-smoking property. Certain pets (non-aggressive breed dogs, cats) may be allowed with a pet fee.
Minimum requirements are 3 times the rental amount in monthly household income. This is not a Section 8 property.
Ownership History
Date
Name
Owned For
Owner Type
Purchase Details
Closed on
Oct 4, 2023
Sold by
Bennett Linda A
Bought by
Questway Llc
Current Estimated Value
Purchase Details
Closed on
Feb 14, 2012
Sold by
Bennett Linda
Bought by
Bennett T & L Ventures Llc
Purchase Details
Closed on
Oct 4, 2011
Sold by
Jpmorgan Chase Bank Nation
Bought by
Federal National Mtg Associati
Create a Home Valuation Report for This Property
The Home Valuation Report is an in-depth analysis detailing your home's value as well as a comparison with similar homes in the area
Home Values in the Area
Average Home Value in this Area
Purchase History
| Date | Buyer | Sale Price | Title Company |
|---|---|---|---|
| Questway Llc | -- | None Listed On Document | |
| Bennett T & L Ventures Llc | -- | -- | |
| Bennett Linda A | $28,500 | -- | |
| Federal National Mtg Associati | $61,200 | -- | |
| Jpmorgan Chase Bank National A | $61,200 | -- |
Source: Public Records
Property History
| Date | Event | Price | List to Sale | Price per Sq Ft |
|---|---|---|---|---|
| 03/14/2025 03/14/25 | Off Market | $875 | -- | -- |
| 03/07/2025 03/07/25 | For Rent | $875 | -- | -- |
Tax History Compared to Growth
Tax History
| Year | Tax Paid | Tax Assessment Tax Assessment Total Assessment is a certain percentage of the fair market value that is determined by local assessors to be the total taxable value of land and additions on the property. | Land | Improvement |
|---|---|---|---|---|
| 2025 | $1,192 | $30,460 | $6,996 | $23,464 |
| 2024 | $924 | $23,604 | $6,996 | $16,608 |
| 2023 | $595 | $23,604 | $6,996 | $16,608 |
| 2022 | $680 | $23,604 | $6,996 | $16,608 |
| 2021 | $680 | $16,644 | $6,996 | $9,648 |
| 2020 | $680 | $16,644 | $6,996 | $9,648 |
| 2019 | $863 | $24,776 | $6,996 | $17,780 |
| 2018 | $1,015 | $24,776 | $6,996 | $17,780 |
| 2017 | $996 | $24,232 | $6,996 | $17,236 |
| 2016 | $990 | $24,000 | $3,497 | $20,503 |
| 2015 | $991 | $24,000 | $3,497 | $20,503 |
| 2014 | $992 | $24,000 | $0 | $0 |
| 2013 | -- | $24,000 | $0 | $0 |
Source: Public Records
Map
Nearby Homes
- 5235 Vincent Dr
- 736 Belvedere Dr
- 719 Wilder Dr
- 558 Wilder Dr
- 727 Wilder Dr
- 822 Reaper Ln
- 752 Wilder Dr
- 702 Corley Dr
- 5526 Buena Vista Rd
- 5532 Buena Vista Rd
- 4903 Chapman St
- 644 Georgia Dr
- 650 Upland Ct
- 100 R C Allen Dr
- 766 Cardinal Ave
- 4722 Pollman St
- 4906 Pollman St
- 4804 Bruning St
- 5529 Pollman St
- 418 Henson Ave
- 618 Beeman Ct
- 659 Barklay Way
- 663 Barklay Way
- 612 Beeman Ct
- 655 Barklay Way
- 623 Beeman Ct
- 629 Beeman Ct
- 606 Beeman Ct
- 615 Beeman Ct
- 649 Barklay Way
- 0 Baltic Ct Unit 8119705
- 0 Baltic Ct
- 702 Baltic Ct
- 603 Beeman Ct
- 602 Beeman Ct
- 711 Barklay Way
- 645 Barklay Way
- 703 Baltic Ct
- 648 Barklay Way
- 710 Baltic Ct