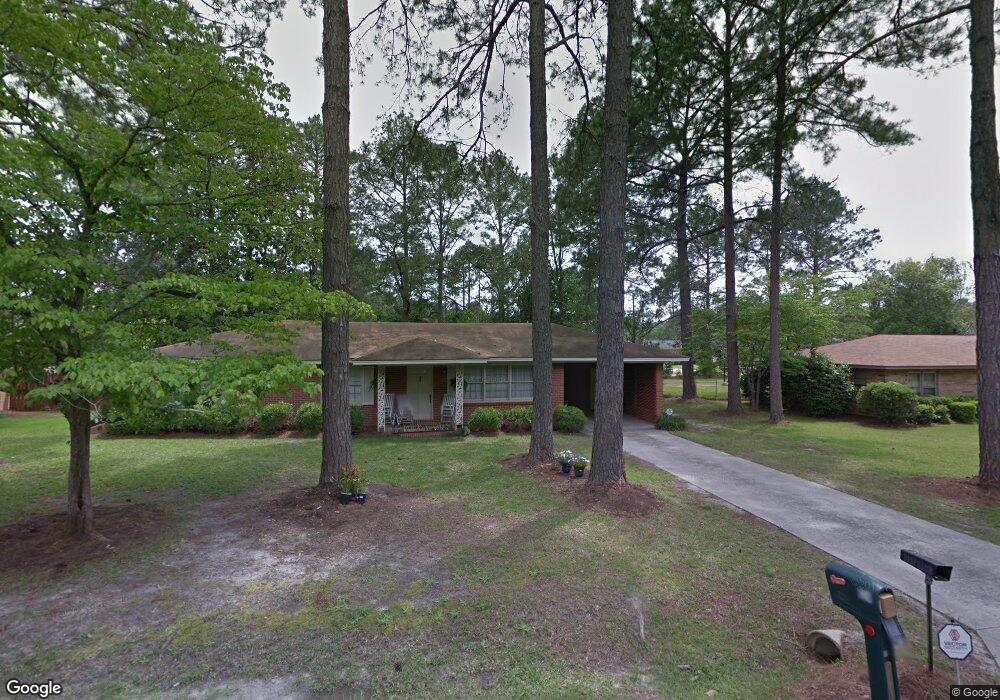
624 E 29th Ave Cordele, GA 31015
Estimated Value: $157,256 - $193,000
3
Beds
2
Baths
1,443
Sq Ft
$124/Sq Ft
Est. Value
About This Home
This home is located at 624 E 29th Ave, Cordele, GA 31015 and is currently estimated at $178,814, approximately $123 per square foot. 624 E 29th Ave is a home located in Crisp County with nearby schools including Crisp County Elementary School, Crisp County Primary School, and Crisp County Middle School.
Ownership History
Date
Name
Owned For
Owner Type
Purchase Details
Closed on
Jul 14, 2022
Sold by
Wade Haley
Bought by
Martin Michele
Current Estimated Value
Home Financials for this Owner
Home Financials are based on the most recent Mortgage that was taken out on this home.
Original Mortgage
$125,760
Outstanding Balance
$120,016
Interest Rate
5.78%
Mortgage Type
New Conventional
Estimated Equity
$58,798
Purchase Details
Closed on
May 23, 2016
Sold by
Carter Lisa
Bought by
Little Haley Nicole
Home Financials for this Owner
Home Financials are based on the most recent Mortgage that was taken out on this home.
Original Mortgage
$77,569
Interest Rate
3.62%
Mortgage Type
FHA
Purchase Details
Closed on
Jul 2, 1999
Sold by
Carter Roy D and Carter Lisa
Bought by
Carter Lisa
Purchase Details
Closed on
Nov 24, 1989
Sold by
Stanford Douglas +
Bought by
Carter Roy D and Carter Lisa
Purchase Details
Closed on
Feb 16, 1983
Bought by
Stanford Douglas +
Create a Home Valuation Report for This Property
The Home Valuation Report is an in-depth analysis detailing your home's value as well as a comparison with similar homes in the area
Purchase History
| Date | Buyer | Sale Price | Title Company |
|---|---|---|---|
| Martin Michele | $157,200 | -- | |
| Little Haley Nicole | $79,000 | -- | |
| Carter Lisa | -- | -- | |
| Carter Roy D | $45,000 | -- | |
| Stanford Douglas + | $50,000 | -- |
Source: Public Records
Mortgage History
| Date | Status | Borrower | Loan Amount |
|---|---|---|---|
| Open | Martin Michele | $125,760 | |
| Previous Owner | Little Haley Nicole | $77,569 |
Source: Public Records
Tax History
| Year | Tax Paid | Tax Assessment Tax Assessment Total Assessment is a certain percentage of the fair market value that is determined by local assessors to be the total taxable value of land and additions on the property. | Land | Improvement |
|---|---|---|---|---|
| 2025 | $1,533 | $57,809 | $1,910 | $55,899 |
| 2024 | $1,410 | $52,086 | $1,910 | $50,176 |
| 2023 | $1,382 | $49,224 | $1,910 | $47,314 |
| 2022 | $1,002 | $35,692 | $1,910 | $33,782 |
| 2021 | $995 | $33,550 | $1,910 | $31,640 |
| 2020 | $996 | $33,550 | $1,910 | $31,640 |
| 2019 | $990 | $33,550 | $1,910 | $31,640 |
| 2018 | $868 | $28,340 | $4,202 | $24,138 |
| 2017 | $872 | $28,340 | $4,202 | $24,138 |
| 2016 | $602 | $28,340 | $4,202 | $24,138 |
| 2015 | -- | $28,340 | $4,202 | $24,138 |
| 2014 | -- | $28,340 | $4,202 | $24,138 |
| 2013 | -- | $28,340 | $4,201 | $24,138 |
Source: Public Records
Map
Nearby Homes
- 622 E 29th Ave
- 626 E 29th Ave
- 610 E 29th Ave
- 621 E 30th Ave
- 625 E 29th Ave
- 609 E 30th Ave
- 1803 S 1st St
- 621 E 29th Ave
- 702 E 29th Ave
- 606 E 29th Ave
- 605 E 30th Ave
- W 30th Ave E Unit 3 061
- E 30th Ave E
- W 30th Ave E Unit 3 060
- 701 E 30th Ave
- 618 E 28th Ave
- 614 E 28th Ave
- 618 E 30th Ave
- 624 E 28th Ave
- 614 E 30th Ave
Your Personal Tour Guide
Ask me questions while you tour the home.