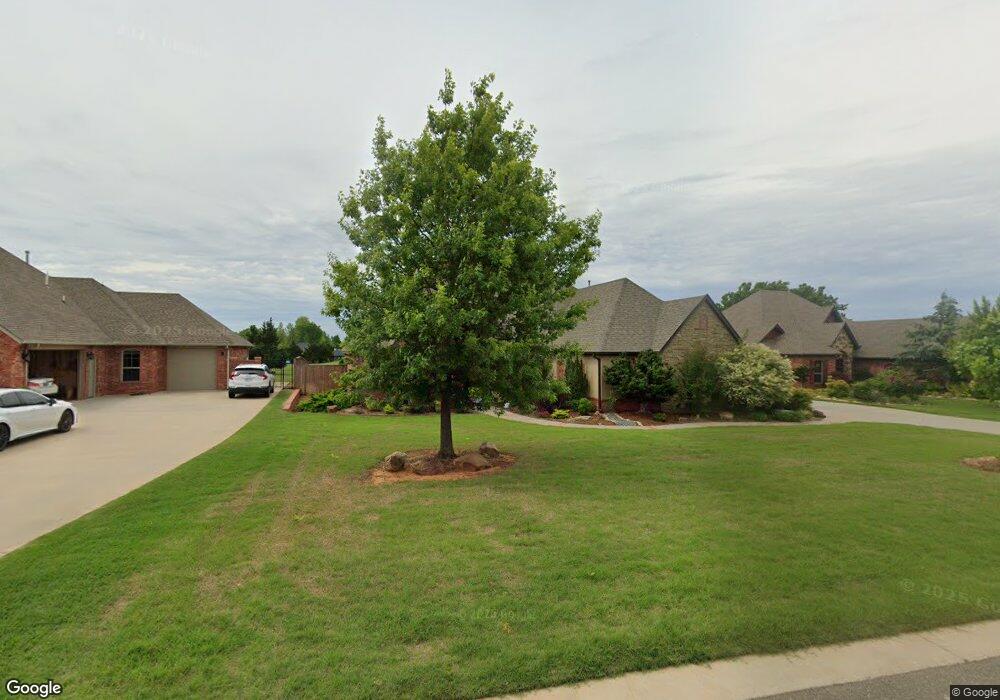
624 E Amelia Terrace Mustang, OK 73064
Estimated Value: $503,000 - $553,000
3
Beds
3
Baths
2,767
Sq Ft
$193/Sq Ft
Est. Value
About This Home
This home is located at 624 E Amelia Terrace, Mustang, OK 73064 and is currently estimated at $533,753, approximately $192 per square foot. 624 E Amelia Terrace is a home with nearby schools including Mustang Elementary School, Mustang Horizon Intermediate School, and Mustang Middle School.
Ownership History
Date
Name
Owned For
Owner Type
Purchase Details
Closed on
Dec 5, 2014
Sold by
Haney Niki Sue and Haney Sean
Bought by
Sharp Kimberly and Sharp Wesley
Current Estimated Value
Home Financials for this Owner
Home Financials are based on the most recent Mortgage that was taken out on this home.
Original Mortgage
$200,000
Outstanding Balance
$153,930
Interest Rate
4.05%
Mortgage Type
New Conventional
Estimated Equity
$379,823
Purchase Details
Closed on
Jul 6, 2012
Sold by
Jason Powers Homes Inc
Bought by
Haney Niki Sue and Haney Sean
Home Financials for this Owner
Home Financials are based on the most recent Mortgage that was taken out on this home.
Original Mortgage
$269,267
Interest Rate
3.81%
Mortgage Type
VA
Purchase Details
Closed on
Feb 15, 2012
Sold by
Little Development Lp
Bought by
Jason Powers Homes Inc
Home Financials for this Owner
Home Financials are based on the most recent Mortgage that was taken out on this home.
Original Mortgage
$212,800
Interest Rate
3.95%
Mortgage Type
Construction
Create a Home Valuation Report for This Property
The Home Valuation Report is an in-depth analysis detailing your home's value as well as a comparison with similar homes in the area
Home Values in the Area
Average Home Value in this Area
Purchase History
| Date | Buyer | Sale Price | Title Company |
|---|---|---|---|
| Sharp Kimberly | $325,000 | Capitol Abstract & Title Co | |
| Haney Niki Sue | $269,000 | Ort | |
| Jason Powers Homes Inc | $43,000 | Ort |
Source: Public Records
Mortgage History
| Date | Status | Borrower | Loan Amount |
|---|---|---|---|
| Open | Sharp Kimberly | $200,000 | |
| Previous Owner | Haney Niki Sue | $269,267 | |
| Previous Owner | Jason Powers Homes Inc | $212,800 |
Source: Public Records
Tax History Compared to Growth
Tax History
| Year | Tax Paid | Tax Assessment Tax Assessment Total Assessment is a certain percentage of the fair market value that is determined by local assessors to be the total taxable value of land and additions on the property. | Land | Improvement |
|---|---|---|---|---|
| 2024 | $4,179 | $44,177 | $6,311 | $37,866 |
| 2023 | $4,179 | $42,890 | $6,294 | $36,596 |
| 2022 | $4,104 | $41,642 | $6,270 | $35,372 |
| 2021 | $3,997 | $40,429 | $6,186 | $34,243 |
| 2020 | $3,902 | $39,252 | $5,997 | $33,255 |
| 2019 | $3,785 | $38,108 | $5,828 | $32,280 |
| 2018 | $3,752 | $36,998 | $5,665 | $31,333 |
| 2017 | $3,598 | $35,921 | $5,400 | $30,521 |
| 2016 | $3,498 | $35,921 | $5,400 | $30,521 |
| 2015 | -- | $33,859 | $5,400 | $28,459 |
| 2014 | -- | $31,312 | $5,160 | $26,152 |
Source: Public Records
Map
Nearby Homes
- 816 E Barajas Terrace
- 532 E Olivia Terrace
- 508 E Olivia Terrace
- 1201 N Vicksburg Terrace
- 1512 N Kamryn Way
- 636 E Lea Terrace
- 408 E Magnolia Terrace
- 341 E Plantation Terrace
- 5412 Santa Lucia Dr
- 313 E Suera Terrace
- 333 E Mobile Terrace
- 5400 Malpaso Creek Dr
- 1109 N Charlotte Terrace
- 944 E Diane Terrace
- 245 E Atlanta Terrace
- 241 E Atlanta Terrace
- 224 N Richard Terrace
- 504 N Russell Terrace
- 10000 SW 38th St
- 10004 SW 38th St
- 632 E Amelia Terrace
- 616 E Amelia Terrace
- 640 E Amelia Terrace
- 608 E Amelia Terrace
- 625 E Amelia Terrace
- 617 E Amelia Terrace
- 633 E Amelia Terrace
- 609 E Amelia Terrace
- 648 E Amelia Terrace
- 600 E Amelia Terrace
- 641 E Amelia Terrace
- 601 E Amelia Terrace
- 656 E Amelia Terrace
- 532 E Amelia Terrace
- 624 E Victoria Terrace
- 649 E Amelia Terrace
- 616 E Victoria Terrace
- 632 E Victoria Terrace
- 533 E Amelia Terrace
- 624 E Plantation Terrace