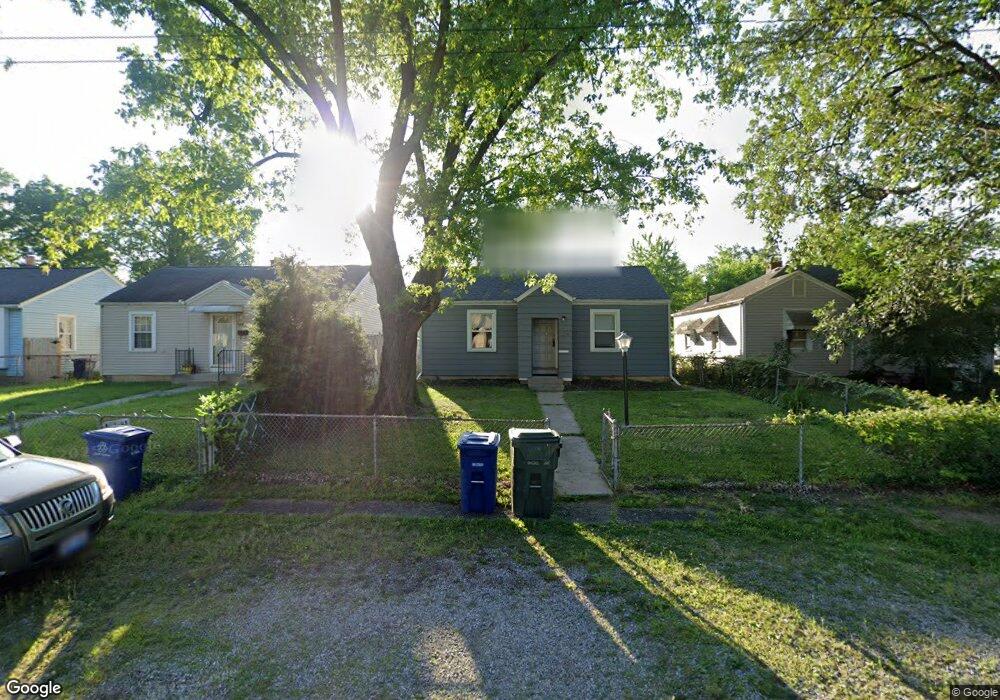
624 N Drexel Ave Columbus, OH 43219
Estimated Value: $125,000 - $143,000
2
Beds
1
Bath
924
Sq Ft
$145/Sq Ft
Est. Value
About This Home
This home is located at 624 N Drexel Ave, Columbus, OH 43219 and is currently estimated at $134,168, approximately $145 per square foot. 624 N Drexel Ave is a home located in Franklin County with nearby schools including East Columbus Elementary School, Champion Middle School, and East High School.
Ownership History
Date
Name
Owned For
Owner Type
Purchase Details
Closed on
Jul 2, 2024
Sold by
Zettler Janet and Zettler Nicholas
Bought by
Mecum Jayme
Current Estimated Value
Home Financials for this Owner
Home Financials are based on the most recent Mortgage that was taken out on this home.
Original Mortgage
$118,750
Outstanding Balance
$117,318
Interest Rate
6.94%
Mortgage Type
New Conventional
Estimated Equity
$16,850
Purchase Details
Closed on
Jun 17, 2024
Sold by
Zettler Janet and Zettler Nicholas
Bought by
Mecum Jayme
Home Financials for this Owner
Home Financials are based on the most recent Mortgage that was taken out on this home.
Original Mortgage
$118,750
Outstanding Balance
$117,318
Interest Rate
6.94%
Mortgage Type
New Conventional
Estimated Equity
$16,850
Purchase Details
Closed on
Mar 30, 2008
Sold by
Grebelsky Alexander
Bought by
Bexley Heights Holdings I
Purchase Details
Closed on
May 2, 1996
Sold by
Ellis John E
Bought by
Alexander Grebelsky
Home Financials for this Owner
Home Financials are based on the most recent Mortgage that was taken out on this home.
Original Mortgage
$21,000
Interest Rate
7.86%
Mortgage Type
New Conventional
Purchase Details
Closed on
Dec 17, 1987
Purchase Details
Closed on
Mar 1, 1987
Create a Home Valuation Report for This Property
The Home Valuation Report is an in-depth analysis detailing your home's value as well as a comparison with similar homes in the area
Home Values in the Area
Average Home Value in this Area
Purchase History
| Date | Buyer | Sale Price | Title Company |
|---|---|---|---|
| Mecum Jayme | $125,000 | Clean Title | |
| Mecum Jayme | $125,000 | Clean Title | |
| Bexley Heights Holdings I | -- | Attorney | |
| Alexander Grebelsky | $30,000 | -- | |
| -- | -- | -- | |
| -- | -- | -- |
Source: Public Records
Mortgage History
| Date | Status | Borrower | Loan Amount |
|---|---|---|---|
| Open | Mecum Jayme | $118,750 | |
| Closed | Mecum Jayme | $118,750 | |
| Previous Owner | Alexander Grebelsky | $21,000 |
Source: Public Records
Tax History Compared to Growth
Tax History
| Year | Tax Paid | Tax Assessment Tax Assessment Total Assessment is a certain percentage of the fair market value that is determined by local assessors to be the total taxable value of land and additions on the property. | Land | Improvement |
|---|---|---|---|---|
| 2024 | $1,962 | $42,810 | $9,210 | $33,600 |
| 2023 | $1,937 | $42,805 | $9,205 | $33,600 |
| 2022 | $1,138 | $21,420 | $1,540 | $19,880 |
| 2021 | $1,140 | $21,420 | $1,540 | $19,880 |
| 2020 | $1,292 | $21,420 | $1,540 | $19,880 |
| 2019 | $677 | $10,890 | $1,400 | $9,490 |
| 2018 | $790 | $10,890 | $1,400 | $9,490 |
| 2017 | $677 | $10,890 | $1,400 | $9,490 |
| 2016 | $992 | $14,600 | $2,030 | $12,570 |
| 2015 | $903 | $14,600 | $2,030 | $12,570 |
| 2014 | $905 | $14,600 | $2,030 | $12,570 |
| 2013 | $524 | $17,150 | $2,380 | $14,770 |
Source: Public Records
Map
Nearby Homes
- 691-693 N Dawson Ave
- 782 Northview Ave
- 796 Northview Ave
- 2742 E 5th Ave
- 2695 Bellwood Ave
- 2822-2824 E 5th Ave
- 797 N Nelson Rd
- 2287 Margaret Ave Unit 289
- 2779 Columbus Ave
- 2250 Willamont Ave
- 291 N Drexel Ave
- 2421 Airport Dr
- 2814 E 9th Ave
- 2278 Ridgeway Ave Unit 278
- 799 Alton Ave
- 2268 Ridgeway Ave
- 2857 E 10th Ave
- 2718 Roxbury Rd
- 2867 Ruhl Ave Unit 869
- 354 N Roosevelt Ave Unit 356
- 628 N Drexel Ave
- 618 N Drexel Ave
- 634 N Drexel Ave
- 638 N Drexel Ave
- 615 Northview Ave
- 619 Northview Ave
- 625 Northview Ave
- 644 N Drexel Ave
- 623 N Drexel Ave
- 2555 Avalon Place
- 629 N Drexel Ave
- 631 Northview Ave
- 2549 Avalon Place
- 2561 Avalon Place
- 617 N Drexel Ave
- 635 N Drexel Ave
- 2543 Avalon Place
- 2567 Avalon Place
- 650 N Drexel Ave
- 637 Northview Ave