Estimated Value: $166,000 - $192,000
3
Beds
2
Baths
1,346
Sq Ft
$137/Sq Ft
Est. Value
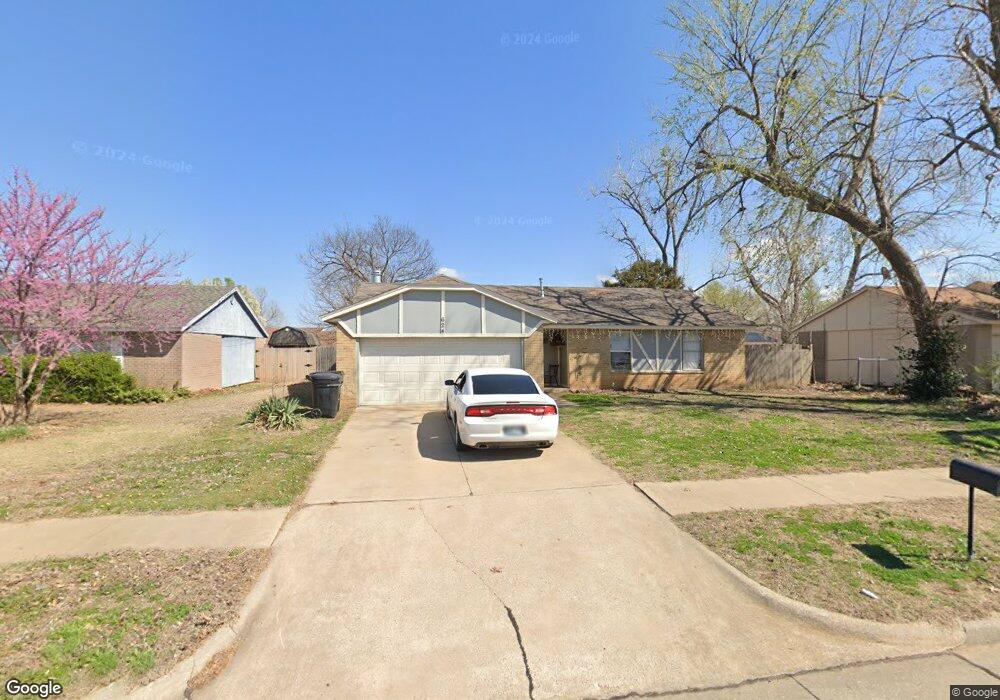
About This Home
This home is located at 624 N Ramblin Oaks Dr, Moore, OK 73160 and is currently estimated at $184,016, approximately $136 per square foot. 624 N Ramblin Oaks Dr is a home located in Cleveland County with nearby schools including Winding Creek Elementary School, Central Junior High School, and Moore High School.
Ownership History
Date
Name
Owned For
Owner Type
Purchase Details
Closed on
Oct 22, 2021
Sold by
Romriell Daniel G and 624 N Ramblin Oaks Drive Trust
Bought by
Romirell Investment Company Llc
Current Estimated Value
Home Financials for this Owner
Home Financials are based on the most recent Mortgage that was taken out on this home.
Original Mortgage
$61,205
Outstanding Balance
$51,752
Interest Rate
2.8%
Mortgage Type
Commercial
Estimated Equity
$132,264
Purchase Details
Closed on
Aug 28, 2019
Sold by
Romriell Investment Company Llc
Bought by
Smith Scott Royal and 624 N Ramblin Oaks Drive Trust
Purchase Details
Closed on
Sep 26, 2008
Sold by
Wiggins Ida I and Wiggins Larry C
Bought by
Qcb 08 Llc
Home Financials for this Owner
Home Financials are based on the most recent Mortgage that was taken out on this home.
Original Mortgage
$1,200,000
Interest Rate
6.57%
Mortgage Type
Credit Line Revolving
Create a Home Valuation Report for This Property
The Home Valuation Report is an in-depth analysis detailing your home's value as well as a comparison with similar homes in the area
Home Values in the Area
Average Home Value in this Area
Purchase History
| Date | Buyer | Sale Price | Title Company |
|---|---|---|---|
| Romirell Investment Company Llc | -- | Oklahoma City Abstract & Ttl | |
| Smith Scott Royal | -- | None Available | |
| Qcb 08 Llc | $65,000 | Fa |
Source: Public Records
Mortgage History
| Date | Status | Borrower | Loan Amount |
|---|---|---|---|
| Open | Romirell Investment Company Llc | $61,205 | |
| Previous Owner | Qcb 08 Llc | $1,200,000 |
Source: Public Records
Tax History Compared to Growth
Tax History
| Year | Tax Paid | Tax Assessment Tax Assessment Total Assessment is a certain percentage of the fair market value that is determined by local assessors to be the total taxable value of land and additions on the property. | Land | Improvement |
|---|---|---|---|---|
| 2024 | $1,728 | $14,243 | $2,869 | $11,374 |
| 2023 | $1,654 | $13,565 | $2,763 | $10,802 |
| 2022 | $1,598 | $12,919 | $2,799 | $10,120 |
| 2021 | $1,530 | $12,304 | $2,400 | $9,904 |
| 2020 | $1,531 | $12,304 | $2,400 | $9,904 |
| 2019 | $1,558 | $12,304 | $2,400 | $9,904 |
| 2018 | $1,558 | $12,304 | $2,400 | $9,904 |
| 2017 | $1,566 | $12,304 | $0 | $0 |
| 2016 | $1,578 | $12,304 | $2,400 | $9,904 |
| 2015 | -- | $12,234 | $2,386 | $9,848 |
| 2014 | -- | $11,652 | $1,251 | $10,401 |
Source: Public Records
Map
Nearby Homes
- 1200 NE 5th St
- 205 N Ramblin Oaks Dr
- 221 N English Dr
- 901 N Avery Dr
- 1401 NE 11th St
- 913 N Avery Dr
- 0 NE 12th St
- 801 N Silver Leaf Dr
- 1105 Oak Creek Dr
- 104 S Ramblin Oaks Dr
- 112 Wellington Ln
- 1824 NE 11th St
- 904 NE 4th St
- 920 Elm Creek Dr
- 1404 Old Mill Rd
- 609 Madeline Ln
- 2105 NE 11th St
- 316 S Ramblin Oaks Dr
- 604 Loyd Ln
- 308 S Patterson Dr
- 620 N Ramblin Oaks Dr
- 628 N Ramblin Oaks Dr
- 632 N Ramblin Oaks Dr
- 616 N Ramblin Oaks Dr
- 625 Champion Ln
- 621 Champion Ln
- 617 Champion Ln
- 629 N Ramblin Oaks Dr
- 621 N Ramblin Oaks Dr
- 613 Champion Ln
- 612 N Ramblin Oaks Dr
- 629 Champion Ln
- 633 N Ramblin Oaks Dr
- 617 N Ramblin Oaks Dr
- 1404 NE 6th St
- 613 N Ramblin Oaks Dr
- 637 N Ramblin Oaks Dr
- 609 Champion Ln
- 633 Champion Ln
- 1400 NE 6th St