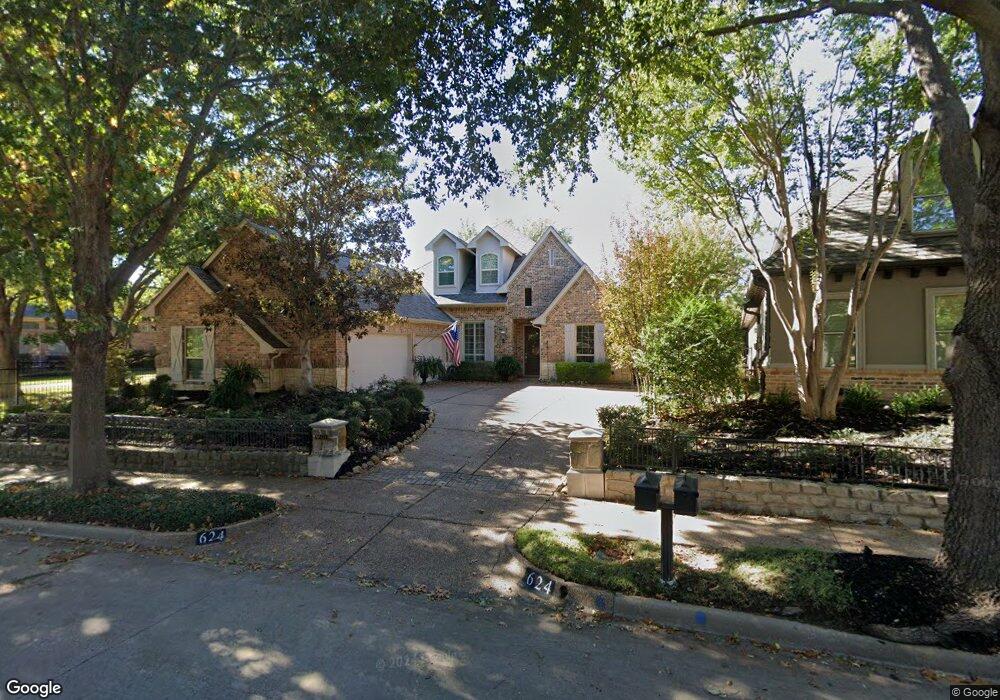
624 Regency Crossing Southlake, TX 76092
Estimated Value: $1,075,114 - $1,270,000
3
Beds
3
Baths
3,214
Sq Ft
$363/Sq Ft
Est. Value
About This Home
This home is located at 624 Regency Crossing, Southlake, TX 76092 and is currently estimated at $1,166,529, approximately $362 per square foot. 624 Regency Crossing is a home located in Tarrant County with nearby schools including Old Union Elementary School, Eubanks Intermediate School, and George Dawson Middle School.
Ownership History
Date
Name
Owned For
Owner Type
Purchase Details
Closed on
Jul 23, 2002
Sold by
Pierce Raymond B and Pierce Mary Jo
Bought by
James Michael and James Melissa
Current Estimated Value
Home Financials for this Owner
Home Financials are based on the most recent Mortgage that was taken out on this home.
Original Mortgage
$300,700
Outstanding Balance
$110,745
Interest Rate
4.87%
Estimated Equity
$1,055,784
Purchase Details
Closed on
Sep 7, 1999
Sold by
Pierce Homes Inc
Bought by
Pierce Raymond B and Pierce Mary Jo
Home Financials for this Owner
Home Financials are based on the most recent Mortgage that was taken out on this home.
Original Mortgage
$268,800
Interest Rate
7.68%
Purchase Details
Closed on
Feb 4, 1999
Sold by
Westerra Timarron Lp
Bought by
Pierce Homes Inc
Create a Home Valuation Report for This Property
The Home Valuation Report is an in-depth analysis detailing your home's value as well as a comparison with similar homes in the area
Home Values in the Area
Average Home Value in this Area
Purchase History
| Date | Buyer | Sale Price | Title Company |
|---|---|---|---|
| James Michael | -- | -- | |
| Pierce Raymond B | -- | Ticor Land Title Company | |
| Pierce Homes Inc | -- | Stewart Title |
Source: Public Records
Mortgage History
| Date | Status | Borrower | Loan Amount |
|---|---|---|---|
| Open | James Michael | $300,700 | |
| Previous Owner | Pierce Raymond B | $268,800 | |
| Closed | James Michael | $95,450 |
Source: Public Records
Tax History Compared to Growth
Tax History
| Year | Tax Paid | Tax Assessment Tax Assessment Total Assessment is a certain percentage of the fair market value that is determined by local assessors to be the total taxable value of land and additions on the property. | Land | Improvement |
|---|---|---|---|---|
| 2025 | $9,000 | $969,541 | $200,000 | $769,541 |
| 2024 | $9,000 | $969,541 | $200,000 | $769,541 |
| 2023 | $15,583 | $1,029,893 | $200,000 | $829,893 |
| 2022 | $16,767 | $888,634 | $140,000 | $748,634 |
| 2021 | $16,109 | $706,553 | $140,000 | $566,553 |
| 2020 | $16,304 | $709,284 | $140,000 | $569,284 |
| 2019 | $16,675 | $717,782 | $140,000 | $577,782 |
| 2018 | $12,230 | $626,015 | $140,000 | $486,015 |
| 2017 | $15,083 | $608,525 | $140,000 | $468,525 |
| 2016 | $13,846 | $558,602 | $140,000 | $418,602 |
| 2015 | $13,651 | $611,105 | $100,000 | $511,105 |
| 2014 | $13,651 | $564,100 | $50,000 | $514,100 |
Source: Public Records
Map
Nearby Homes
- 1420 Kensington Ct
- 608 Regency Crossing
- 521 Regency Crossing
- 1227 Strathmore Dr
- 7322 Calloway Ct
- 7316 Calloway Ct
- 1417 Nottoway Ct
- 1418 Nottoway Ct
- 1406 Nottoway Ct
- 710 Longford Dr
- 7208 Stilton Ct
- 7106 Belle Meade Dr
- 7200 Belle Meade Dr
- 1719 Byron Nelson Pkwy
- 7255 Oak Alley Dr
- 7312 Hix Ct
- 708 Nettleton Dr
- 7012 Shepherds Glen
- 1100 La Paloma Ct
- 7001 Colleyville Blvd
- 626 Regency Crossing
- 622 Regency Crossing
- 628 Regency Crossing
- 617 Chandon Ct
- 615 Chandon Ct
- 621 Chandon Ct
- 623 Chandon Ct
- 620 Regency Crossing
- 613 Chandon Ct
- 630 Regency Crossing
- 625 Chandon Ct
- 627 Chandon Ct
- 609 Chandon Ct
- 618 Regency Crossing
- 632 Regency Crossing
- 629 Chandon Ct
- 607 Chandon Ct
- 616 Regency Crossing
- 1305 Avon Terrace
- 634 Regency Crossing