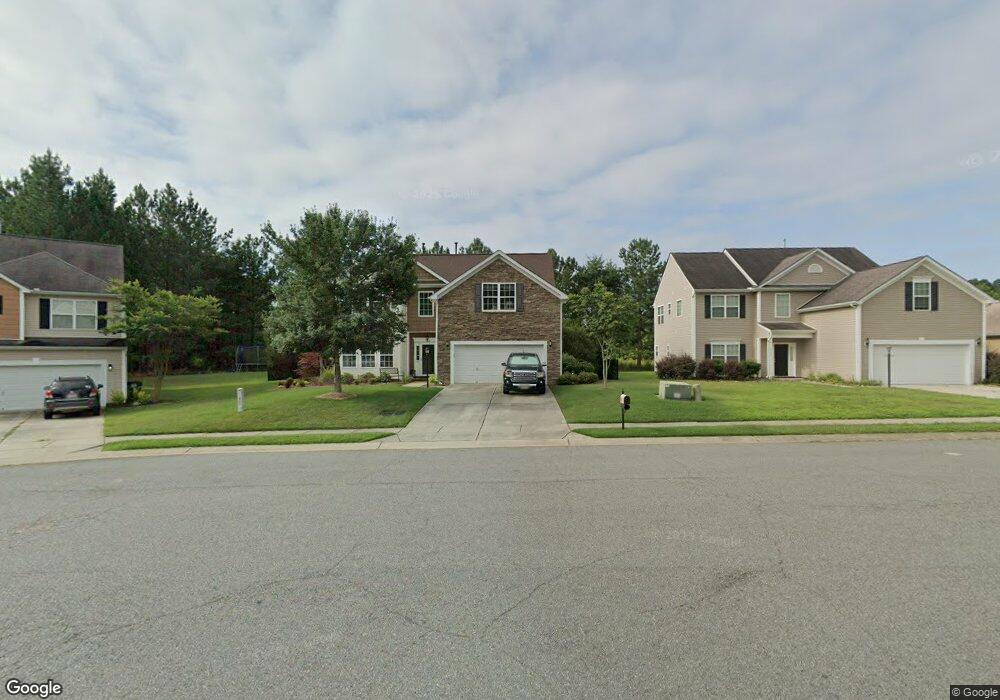
624 Settlers Grove Ln Salisbury, NC 28146
Estimated Value: $419,437 - $494,000
4
Beds
6
Baths
2,889
Sq Ft
$156/Sq Ft
Est. Value
About This Home
This home is located at 624 Settlers Grove Ln, Salisbury, NC 28146 and is currently estimated at $450,859, approximately $156 per square foot. 624 Settlers Grove Ln is a home located in Rowan County with nearby schools including Elizabeth Duncan Koontz Elementary School, Southeast Middle School, and Jesse C Carson High School.
Ownership History
Date
Name
Owned For
Owner Type
Purchase Details
Closed on
Nov 19, 2014
Sold by
Kennedy Julia and Kennedy Timothy
Bought by
Kennedy Timothy and Kennedy Julia
Current Estimated Value
Home Financials for this Owner
Home Financials are based on the most recent Mortgage that was taken out on this home.
Original Mortgage
$221,600
Outstanding Balance
$169,753
Interest Rate
4%
Mortgage Type
New Conventional
Estimated Equity
$281,106
Purchase Details
Closed on
Jun 20, 2008
Sold by
Southampton Group Llc
Bought by
Mobley Julia and Kennedy Timothy
Home Financials for this Owner
Home Financials are based on the most recent Mortgage that was taken out on this home.
Original Mortgage
$242,562
Interest Rate
6.04%
Mortgage Type
Unknown
Purchase Details
Closed on
Mar 13, 2008
Sold by
Settlers Grove Llc
Bought by
Southampton Group Llc
Home Financials for this Owner
Home Financials are based on the most recent Mortgage that was taken out on this home.
Original Mortgage
$204,200
Interest Rate
5.63%
Mortgage Type
Unknown
Create a Home Valuation Report for This Property
The Home Valuation Report is an in-depth analysis detailing your home's value as well as a comparison with similar homes in the area
Home Values in the Area
Average Home Value in this Area
Purchase History
| Date | Buyer | Sale Price | Title Company |
|---|---|---|---|
| Kennedy Timothy | -- | Servicelink | |
| Mobley Julia | $255,500 | None Available | |
| Southampton Group Llc | $41,500 | None Available |
Source: Public Records
Mortgage History
| Date | Status | Borrower | Loan Amount |
|---|---|---|---|
| Open | Kennedy Timothy | $221,600 | |
| Closed | Mobley Julia | $242,562 | |
| Previous Owner | Southampton Group Llc | $204,200 |
Source: Public Records
Tax History Compared to Growth
Tax History
| Year | Tax Paid | Tax Assessment Tax Assessment Total Assessment is a certain percentage of the fair market value that is determined by local assessors to be the total taxable value of land and additions on the property. | Land | Improvement |
|---|---|---|---|---|
| 2025 | $2,698 | $402,653 | $35,500 | $367,153 |
| 2024 | $2,698 | $402,653 | $35,500 | $367,153 |
| 2023 | $2,698 | $402,653 | $35,500 | $367,153 |
| 2022 | $1,939 | $259,379 | $32,000 | $227,379 |
| 2021 | $1,919 | $259,379 | $32,000 | $227,379 |
| 2020 | $1,939 | $259,379 | $32,000 | $227,379 |
| 2019 | $1,919 | $259,379 | $32,000 | $227,379 |
| 2018 | $1,604 | $220,034 | $32,000 | $188,034 |
| 2017 | $1,604 | $220,034 | $32,000 | $188,034 |
| 2016 | $1,604 | $220,034 | $32,000 | $188,034 |
| 2015 | $1,628 | $220,034 | $32,000 | $188,034 |
| 2014 | $1,702 | $233,973 | $40,000 | $193,973 |
Source: Public Records
Map
Nearby Homes
- 555 Settlers Grove Ln
- 509 Settlers Grove Ln
- 312 Settlers Grove Ln
- 1180 Grist Mill Run
- 137 Stafford Estates Dr
- 1345 Standing Oak Dr
- 155 Trailwood Ct
- 1205 Standing Oak Dr
- 327 River Birch Dr
- 629 Cordova Ct
- 822 Wisteria Way
- 237 River Birch Dr
- 415 Garner Dr
- 495 Pepperstone Dr
- 1050 Julian Rd
- 3130 Faith Rd
- 105 Tyler Ct
- 330 Oak Ridge Run
- 200 N Kayla Dr
- 0 Old Concord Rd Unit 10094451
- 612 Settlers Grove Ln
- 630 Settlers Grove Ln
- 598 Settlers Grove Ln
- 634 Settlers Grove Ln
- 613 Settlers Grove Ln
- 629 Settlers Grove Ln
- 584 Settlers Grove Ln
- 599 Settlers Grove Ln
- 637 Settlers Grove Ln
- 585 Settlers Grove Ln
- 568 Settlers Grove Ln
- 569 Settlers Grove Ln
- 554 Settlers Grove Ln
- 540 Settlers Grove Ln Unit 33
- 540 Settlers Grove Ln
- 541 Settlers Grove Ln Unit 49
- 524 Settlers Grove Ln
- 498 Settlers Grove Ln
- 484 Settlers Grove Ln
- 484 Settlers Grove Ln