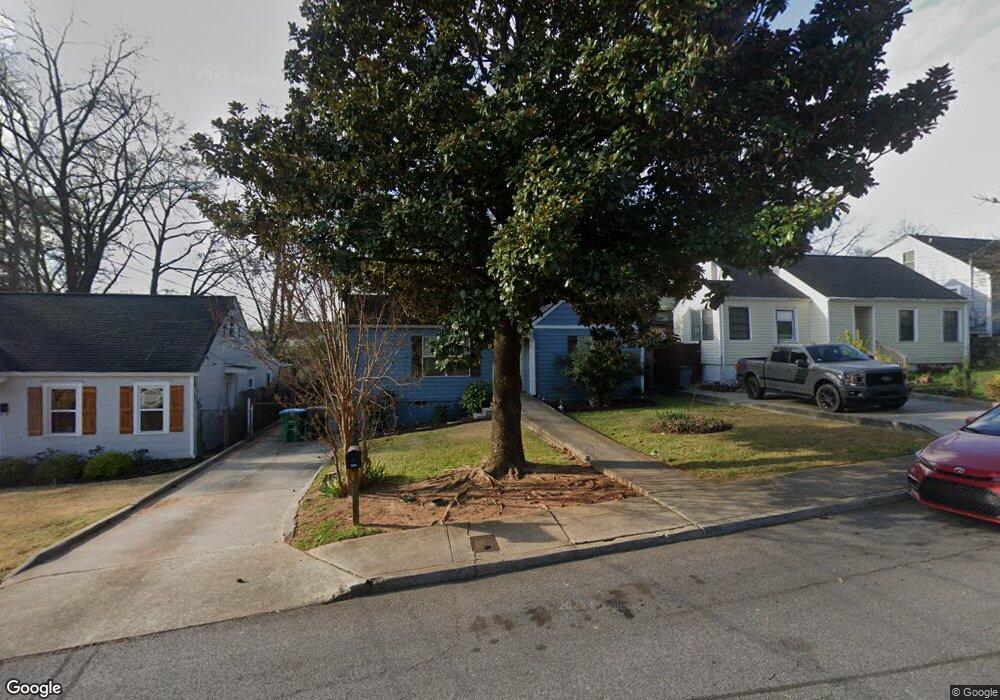
624 Spring St Unit 12 Atlanta, GA 30354
Estimated Value: $330,970 - $508,000
5
Beds
4
Baths
830
Sq Ft
$506/Sq Ft
Est. Value
About This Home
This home is located at 624 Spring St Unit 12, Atlanta, GA 30354 and is currently estimated at $419,743, approximately $505 per square foot. 624 Spring St Unit 12 is a home located in Fulton County with nearby schools including Hapeville Elementary School, Paul D. West Middle School, and Tri-Cities High School.
Ownership History
Date
Name
Owned For
Owner Type
Purchase Details
Closed on
Jan 14, 2020
Sold by
Gunn Sean
Bought by
Gunn Sean and Gunn Halevi
Current Estimated Value
Home Financials for this Owner
Home Financials are based on the most recent Mortgage that was taken out on this home.
Original Mortgage
$240,000
Outstanding Balance
$212,458
Interest Rate
3.7%
Mortgage Type
New Conventional
Estimated Equity
$207,285
Purchase Details
Closed on
Jun 30, 2017
Bought by
Gunn Sean
Home Financials for this Owner
Home Financials are based on the most recent Mortgage that was taken out on this home.
Original Mortgage
$118,400
Interest Rate
3.94%
Mortgage Type
New Conventional
Purchase Details
Closed on
Sep 11, 2013
Sold by
Wright Frances I
Bought by
Robert Kennedy Llc
Purchase Details
Closed on
Nov 30, 1998
Sold by
Johnston Lloyd A
Bought by
Wright Frances I
Home Financials for this Owner
Home Financials are based on the most recent Mortgage that was taken out on this home.
Original Mortgage
$29,645
Interest Rate
6.9%
Mortgage Type
New Conventional
Create a Home Valuation Report for This Property
The Home Valuation Report is an in-depth analysis detailing your home's value as well as a comparison with similar homes in the area
Home Values in the Area
Average Home Value in this Area
Purchase History
| Date | Buyer | Sale Price | Title Company |
|---|---|---|---|
| Gunn Sean | -- | -- | |
| Gunn Sean | $148,000 | -- | |
| Robert Kennedy Llc | $7,400 | -- | |
| Wright Frances I | -- | -- |
Source: Public Records
Mortgage History
| Date | Status | Borrower | Loan Amount |
|---|---|---|---|
| Open | Gunn Sean | $240,000 | |
| Previous Owner | Gunn Sean | $118,400 | |
| Previous Owner | Wright Frances I | $29,645 |
Source: Public Records
Tax History
| Year | Tax Paid | Tax Assessment Tax Assessment Total Assessment is a certain percentage of the fair market value that is determined by local assessors to be the total taxable value of land and additions on the property. | Land | Improvement |
|---|---|---|---|---|
| 2025 | $2,306 | $151,880 | $18,640 | $133,240 |
| 2023 | $3,322 | $117,680 | $16,800 | $100,880 |
| 2022 | $3,096 | $117,680 | $16,800 | $100,880 |
| 2021 | $3,912 | $91,280 | $15,960 | $75,320 |
| 2020 | $3,950 | $90,200 | $15,760 | $74,440 |
| 2019 | $1,318 | $81,840 | $12,000 | $69,840 |
| 2018 | $1,241 | $43,960 | $5,680 | $38,280 |
| 2017 | $348 | $11,928 | $2,328 | $9,600 |
| 2016 | $348 | $11,930 | $2,330 | $9,600 |
| 2015 | $548 | $11,930 | $2,330 | $9,600 |
| 2014 | $366 | $11,930 | $2,330 | $9,600 |
Source: Public Records
Map
Nearby Homes
- 3300 Dogwood Dr Unit 311
- 611 King Arnold St
- 523 North Ave
- 651 North Ave
- 3216 Dogwood Dr
- 535 Walnut St
- 511 Walnut St
- 3338 Sims St
- 3350 Sims St
- 947 Willingham Dr Unit 2
- 3349 Old Jonesboro Rd
- 3299 Sims St
- 3260 Russell St
- 3189 Jackson St
- 3189 Jackson St Unit A
- 3301 Sims St
- 52 Central Park Dr
- 447 Walnut St
- 754 North Ave
- 3165 Dogwood Dr Unit 106
- 624 Spring St
- 628 Spring St
- 620 Spring St
- 616 Spring St Unit 14
- 616 Spring St
- 632 Spring St
- 71 Spring St
- 579 Marina St
- 571 Marina St
- 585 Marina St
- 585 Marina St Unit 38
- 585 Marina St
- 565 Marina St
- 629 Spring St
- 610 Spring St
- 3352 Magnolia Ct
- 625 Spring St
- 3354 Magnolia Ct
- 3356 Magnolia Ct
- 621 Spring St
Your Personal Tour Guide
Ask me questions while you tour the home.