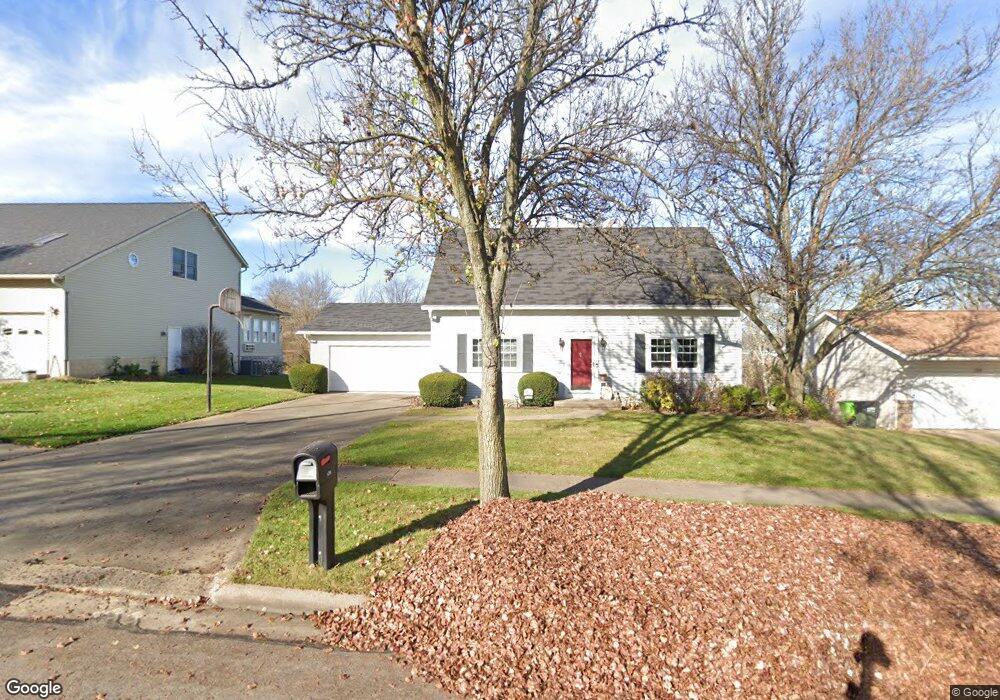
624 Tori Cir Wooster, OH 44691
Estimated Value: $260,000 - $306,000
3
Beds
2
Baths
1,512
Sq Ft
$187/Sq Ft
Est. Value
About This Home
This home is located at 624 Tori Cir, Wooster, OH 44691 and is currently estimated at $282,835, approximately $187 per square foot. 624 Tori Cir is a home located in Wayne County with nearby schools including Kean Elementary School, Parkview Elementary School, and Edgewood Middle School.
Ownership History
Date
Name
Owned For
Owner Type
Purchase Details
Closed on
Nov 14, 2002
Sold by
Field Kent E
Bought by
Smith Frederick G and Smith Karen S
Current Estimated Value
Home Financials for this Owner
Home Financials are based on the most recent Mortgage that was taken out on this home.
Original Mortgage
$103,600
Outstanding Balance
$43,649
Interest Rate
6.1%
Mortgage Type
New Conventional
Estimated Equity
$239,186
Purchase Details
Closed on
Dec 21, 1994
Sold by
Wright James J
Bought by
Field Kent E and Field Connie S
Home Financials for this Owner
Home Financials are based on the most recent Mortgage that was taken out on this home.
Original Mortgage
$97,000
Interest Rate
9.19%
Mortgage Type
New Conventional
Purchase Details
Closed on
Mar 11, 1994
Sold by
Brown Yvonne D and Brown Arthur J
Bought by
Wright James J and Wright Kathy D
Purchase Details
Closed on
Jul 21, 1993
Sold by
Bernhardt J R
Bought by
Brown Yvonne D and Brown Arthur J
Create a Home Valuation Report for This Property
The Home Valuation Report is an in-depth analysis detailing your home's value as well as a comparison with similar homes in the area
Home Values in the Area
Average Home Value in this Area
Purchase History
| Date | Buyer | Sale Price | Title Company |
|---|---|---|---|
| Smith Frederick G | $129,500 | -- | |
| Field Kent E | $110,000 | -- | |
| Wright James J | $114,600 | -- | |
| Brown Yvonne D | $110,000 | -- |
Source: Public Records
Mortgage History
| Date | Status | Borrower | Loan Amount |
|---|---|---|---|
| Open | Smith Frederick G | $103,600 | |
| Previous Owner | Field Kent E | $97,000 |
Source: Public Records
Tax History Compared to Growth
Tax History
| Year | Tax Paid | Tax Assessment Tax Assessment Total Assessment is a certain percentage of the fair market value that is determined by local assessors to be the total taxable value of land and additions on the property. | Land | Improvement |
|---|---|---|---|---|
| 2024 | $2,729 | $65,790 | $12,850 | $52,940 |
| 2023 | $2,729 | $65,790 | $12,850 | $52,940 |
| 2022 | $2,598 | $49,850 | $9,740 | $40,110 |
| 2021 | $2,680 | $49,850 | $9,740 | $40,110 |
| 2020 | $2,540 | $49,850 | $9,740 | $40,110 |
| 2019 | $2,157 | $40,630 | $8,700 | $31,930 |
| 2018 | $2,163 | $40,630 | $8,700 | $31,930 |
| 2017 | $2,222 | $40,630 | $8,700 | $31,930 |
| 2016 | $2,336 | $40,630 | $8,700 | $31,930 |
| 2015 | $2,293 | $40,630 | $8,700 | $31,930 |
| 2014 | $2,294 | $40,630 | $8,700 | $31,930 |
| 2013 | $2,219 | $38,840 | $8,870 | $29,970 |
Source: Public Records
Map
Nearby Homes
- 0 Winkler Dr
- 3393 Friendsville Rd
- 3377 Friendsville Rd
- 220 Kinney St
- 3271 Bayberry Cove
- 458 Mather Hill Dr
- 3569 Cleveland Rd
- 471 Mather Hill Dr
- V/L 6838 Forest Creek Dr
- 594 Forest Creek Dr
- 1315 E Milltown Rd
- 539 Forest Creek Dr Unit 6842
- 751 Greenwood Blvd
- 2782 Tanglewood Dr
- 1425 Hickory Ln
- 1495 Summerlin Dr
- 2580 Christmas Run Blvd
- 2208 Cleveland Rd
- 2206 Graustark Path
- 728 Portage Rd
- 642 Tori Cir
- 606 Tori Cir
- 3301 Shelly Blvd
- 623 Tori Cir
- 0 Tori Cir
- 605 Tori Cir
- 641 Tori Cir
- 3241 Shelly Blvd
- 661 Tori Cir
- 655 Tori Cir
- 3229 Shelly Blvd
- 3207 Shelly Blvd
- 3217 Shelly Blvd
- 3252 Shelly Blvd
- 3300 Shelly Blvd
- 3240 Shelly Blvd
- 3228 Shelly Blvd
- 0 Shelly Blvd
- 3216 Shelly Blvd
- 3161 Shelly Blvd