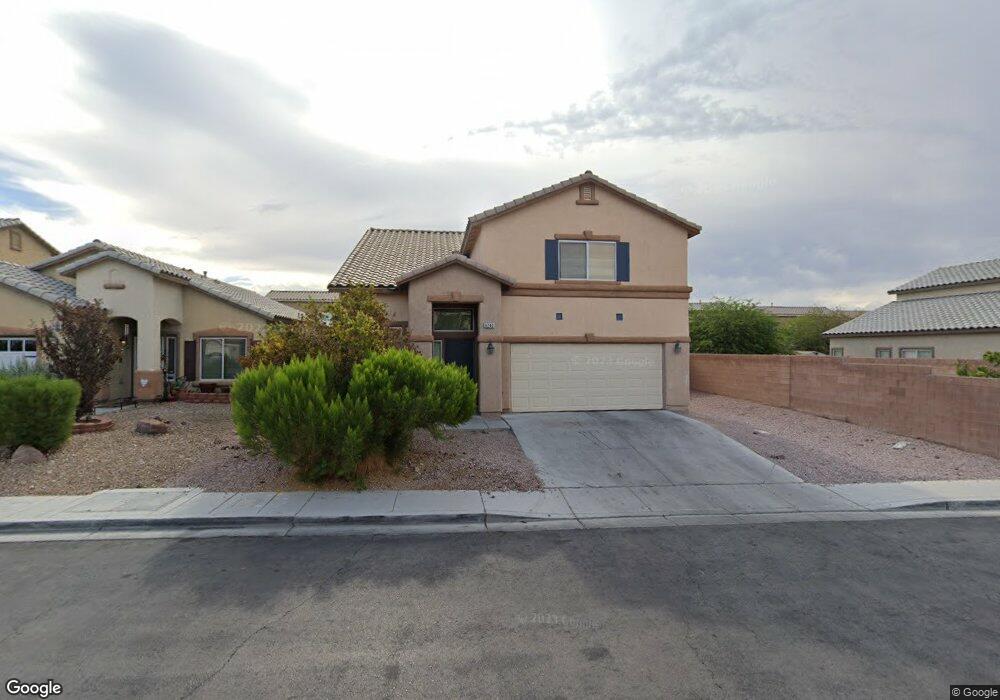
6240 Fort Worth St Unit 1 North Las Vegas, NV 89081
Northridge NeighborhoodEstimated Value: $407,000 - $426,000
4
Beds
3
Baths
1,960
Sq Ft
$212/Sq Ft
Est. Value
About This Home
This home is located at 6240 Fort Worth St Unit 1, North Las Vegas, NV 89081 and is currently estimated at $414,852, approximately $211 per square foot. 6240 Fort Worth St Unit 1 is a home located in Clark County with nearby schools including D.L. Dusty Dickens Elementary School, Carroll M. Johnston STEM Academy of Environmental Studies, and Clifford O. Findlay Middle School.
Ownership History
Date
Name
Owned For
Owner Type
Purchase Details
Closed on
Feb 14, 2024
Sold by
Tran Mary
Bought by
Trung Van Nguyen And Mary Tran Family Trust and Tran
Current Estimated Value
Purchase Details
Closed on
Nov 10, 2014
Sold by
Nguyen Dennis and Nguyen Daisy
Bought by
Tran Mary
Purchase Details
Closed on
Aug 5, 2011
Sold by
Tran Mary
Bought by
Nguyen Dennis and Nguyen Daisy
Purchase Details
Closed on
Nov 6, 2006
Sold by
Pham Loc Bao
Bought by
Tran Mary
Purchase Details
Closed on
Dec 14, 2005
Sold by
Pecos Centennial Llc
Bought by
Pham Loc Bao
Home Financials for this Owner
Home Financials are based on the most recent Mortgage that was taken out on this home.
Original Mortgage
$287,650
Interest Rate
5.87%
Mortgage Type
Fannie Mae Freddie Mac
Create a Home Valuation Report for This Property
The Home Valuation Report is an in-depth analysis detailing your home's value as well as a comparison with similar homes in the area
Home Values in the Area
Average Home Value in this Area
Purchase History
| Date | Buyer | Sale Price | Title Company |
|---|---|---|---|
| Trung Van Nguyen And Mary Tran Family Trust | -- | None Listed On Document | |
| Tran Mary | $149,000 | None Available | |
| Nguyen Dennis | $117,743 | None Available | |
| Tran Mary | $319,643 | None Available | |
| Pham Loc Bao | $319,643 | Chicago Title |
Source: Public Records
Mortgage History
| Date | Status | Borrower | Loan Amount |
|---|---|---|---|
| Previous Owner | Pham Loc Bao | $287,650 |
Source: Public Records
Tax History Compared to Growth
Tax History
| Year | Tax Paid | Tax Assessment Tax Assessment Total Assessment is a certain percentage of the fair market value that is determined by local assessors to be the total taxable value of land and additions on the property. | Land | Improvement |
|---|---|---|---|---|
| 2025 | $2,174 | $112,807 | $31,850 | $80,957 |
| 2024 | $2,014 | $112,807 | $31,850 | $80,957 |
| 2023 | $2,014 | $107,076 | $30,800 | $76,276 |
| 2022 | $1,865 | $93,007 | $23,450 | $69,557 |
| 2021 | $1,727 | $87,059 | $21,000 | $66,059 |
| 2020 | $1,600 | $86,401 | $21,000 | $65,401 |
| 2019 | $1,500 | $82,284 | $18,200 | $64,084 |
| 2018 | $1,431 | $70,944 | $14,000 | $56,944 |
| 2017 | $2,110 | $62,871 | $11,550 | $51,321 |
| 2016 | $1,341 | $55,311 | $9,800 | $45,511 |
| 2015 | $1,337 | $45,236 | $7,700 | $37,536 |
| 2014 | $1,295 | $37,426 | $4,900 | $32,526 |
Source: Public Records
Map
Nearby Homes
- 6247 Fort Worth St Unit 1
- 3844 Hollycroft Dr
- 3913 Pepper Thorn Ave Unit 201
- 3760 Hollycroft Dr
- 6329 Blowing Sky St Unit 201
- 6312 Beige Bluff St Unit 102
- 6316 Beige Bluff St Unit 201
- 6344 Legend Falls St Unit 2
- 3920 Smokey Fog Ave Unit 201
- 3760 E Carisbrook Dr
- 6079 Salsbury Cove Dr
- 4021 Pepper Thorn Ave Unit 102
- 3720 Gallowtree Ave
- 6328 Sandy Ridge St Unit 201
- 6313 Snap Ridge St Unit 201
- 6052 Puesta Del Sol St
- 4016 Gaster Ave
- 6323 Pacific Sky St
- 4116 Cloudy Night Ave
- 4017 Kristina Lynn Ave
- 6244 Fort Worth St
- 6232 Fort Worth St Unit 1
- 6248 Fort Worth St
- 6239 Sereno Springs St
- 6243 Sereno Springs St
- 6228 Fort Worth St
- 6231 Sereno Springs St
- 6252 Fort Worth St
- 6239 Fort Worth St
- 6243 Fort Worth St
- 6235 Fort Worth St
- 6227 Sereno Springs St
- 6224 Fort Worth St
- 6231 Fort Worth St
- 6304 Fort Worth St
- 6251 Fort Worth St
- 6227 Fort Worth St
- 6223 Sereno Springs St
- 6220 Fort Worth St
- 6305 Fort Worth St