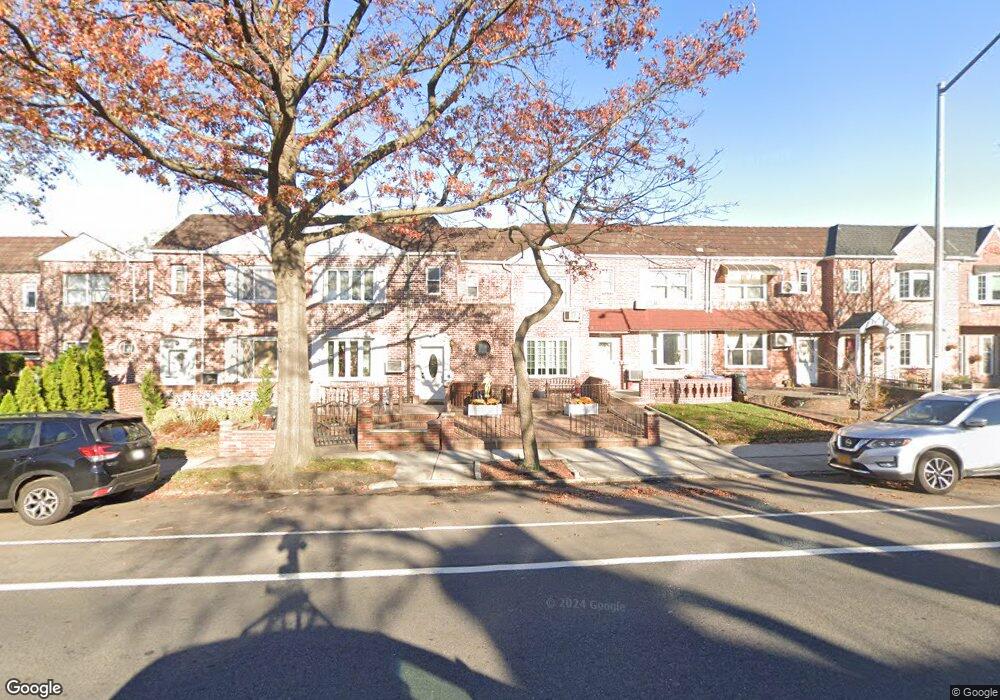
6243 80th St Middle Village, NY 11379
Middle Village NeighborhoodEstimated Value: $874,667 - $973,000
--
Bed
--
Bath
1,224
Sq Ft
$762/Sq Ft
Est. Value
About This Home
This home is located at 6243 80th St, Middle Village, NY 11379 and is currently estimated at $932,917, approximately $762 per square foot. 6243 80th St is a home located in Queens County with nearby schools including P.S. 49 - Dorothy Bonawit Kole, Newtown High School, and St. Margaret Catholic Academy.
Ownership History
Date
Name
Owned For
Owner Type
Purchase Details
Closed on
Nov 23, 2021
Sold by
Livi Jose and Livi Priscilla
Bought by
Jose L Ruffy Trustee and Jose L.Ruffy And Priscilla D. Ruffy Livi
Current Estimated Value
Home Financials for this Owner
Home Financials are based on the most recent Mortgage that was taken out on this home.
Original Mortgage
$6,983
Interest Rate
3.55%
Mortgage Type
Purchase Money Mortgage
Purchase Details
Closed on
May 24, 2011
Sold by
Ruffy Mariquitta and Ruffy Priscilla
Bought by
Ruffy Jose and Ruffy Priscilla
Purchase Details
Closed on
Feb 13, 2002
Sold by
Jaffe Eugene - Exec and Jaffe Jack
Bought by
Ruffy Mariquitta and Ruffy Priscilla
Home Financials for this Owner
Home Financials are based on the most recent Mortgage that was taken out on this home.
Original Mortgage
$252,000
Interest Rate
6.84%
Create a Home Valuation Report for This Property
The Home Valuation Report is an in-depth analysis detailing your home's value as well as a comparison with similar homes in the area
Home Values in the Area
Average Home Value in this Area
Purchase History
| Date | Buyer | Sale Price | Title Company |
|---|---|---|---|
| Jose L Ruffy Trustee | -- | -- | |
| Ruffy Jose | -- | -- | |
| Ruffy Mariquitta | -- | -- |
Source: Public Records
Mortgage History
| Date | Status | Borrower | Loan Amount |
|---|---|---|---|
| Previous Owner | Jose L Ruffy Trustee | $6,983 | |
| Previous Owner | Ruffy Mariquitta | $252,000 |
Source: Public Records
Tax History Compared to Growth
Tax History
| Year | Tax Paid | Tax Assessment Tax Assessment Total Assessment is a certain percentage of the fair market value that is determined by local assessors to be the total taxable value of land and additions on the property. | Land | Improvement |
|---|---|---|---|---|
| 2025 | $7,836 | $41,275 | $11,848 | $29,427 |
| 2024 | $7,848 | $40,415 | $12,320 | $28,095 |
| 2023 | $7,404 | $38,263 | $11,087 | $27,176 |
| 2022 | $6,923 | $48,000 | $14,760 | $33,240 |
| 2021 | $6,943 | $46,980 | $14,760 | $32,220 |
| 2020 | $6,985 | $45,480 | $14,760 | $30,720 |
| 2019 | $6,752 | $47,340 | $14,760 | $32,580 |
| 2018 | $6,202 | $31,886 | $11,095 | $20,791 |
| 2017 | $5,836 | $30,097 | $11,903 | $18,194 |
| 2016 | $5,420 | $30,097 | $11,903 | $18,194 |
| 2015 | $3,205 | $28,663 | $13,353 | $15,310 |
| 2014 | $3,205 | $28,066 | $14,678 | $13,388 |
Source: Public Records
Map
Nearby Homes
- 62-02 78th St
- 6286 Dry Harbor Rd
- 6134 80th St
- 61-33 78th St
- 6329 Dry Harbor Rd
- 62-50 83rd St
- 62 W 83rd St Unit 1
- 6356 78th St
- 6364 78th St
- 62-53 83rd St
- 82-15 Penelope Ave
- 8223 Caldwell Ave
- 6409 78th St
- 63-61 77th St
- 8017 Cowles Ct
- 82-91 Caldwell Ave
- 64-22 79th St
- 61-34 76th St
- 80-4 Cowles Ct
- 60-35 77th St