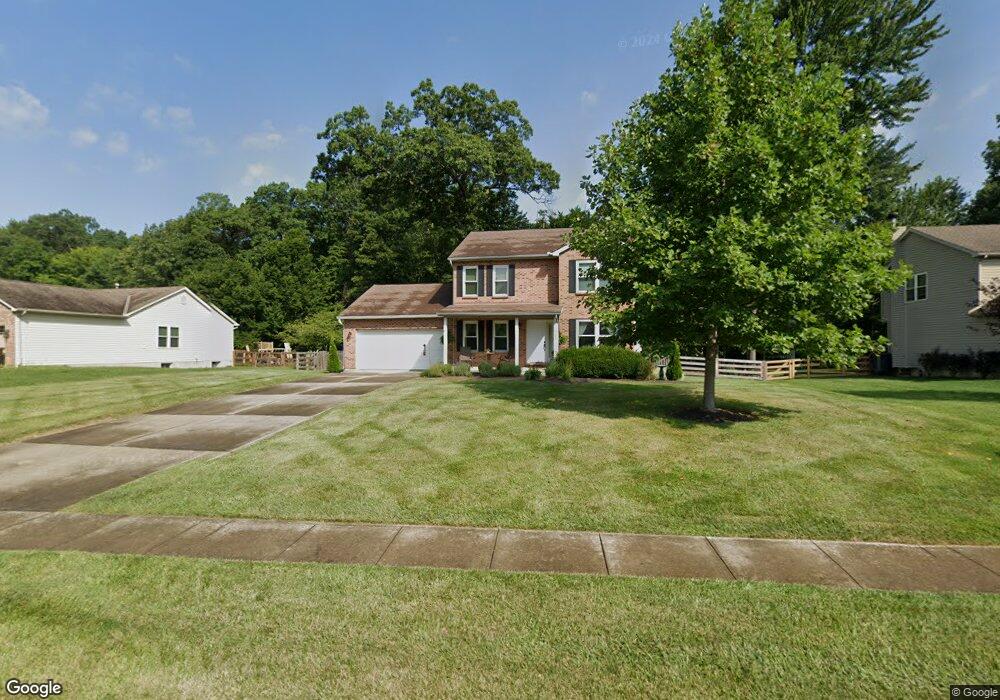
6244 Deerhaven Ln Loveland, OH 45140
Outer Loveland NeighborhoodEstimated Value: $374,000 - $438,000
3
Beds
3
Baths
1,840
Sq Ft
$215/Sq Ft
Est. Value
About This Home
This home is located at 6244 Deerhaven Ln, Loveland, OH 45140 and is currently estimated at $396,128, approximately $215 per square foot. 6244 Deerhaven Ln is a home located in Clermont County with nearby schools including Milford Senior High School, Milford Christian Academy, and St. Andrew - St. Elizabeth Ann Seton School.
Ownership History
Date
Name
Owned For
Owner Type
Purchase Details
Closed on
Sep 11, 2004
Sold by
Boody Michael E and Boody Toni L
Bought by
Greenberg Marc L and Greenberg Sharon L Tomko
Current Estimated Value
Home Financials for this Owner
Home Financials are based on the most recent Mortgage that was taken out on this home.
Original Mortgage
$138,400
Interest Rate
5.93%
Mortgage Type
Purchase Money Mortgage
Purchase Details
Closed on
Aug 22, 2001
Sold by
Somerset Custom Homes In
Bought by
Boody Michael E and Boody Toni L
Home Financials for this Owner
Home Financials are based on the most recent Mortgage that was taken out on this home.
Original Mortgage
$157,500
Interest Rate
7.28%
Mortgage Type
New Conventional
Purchase Details
Closed on
Aug 10, 1999
Sold by
Trst Richard Hoffman
Bought by
Somerset Custom Homes Inc
Create a Home Valuation Report for This Property
The Home Valuation Report is an in-depth analysis detailing your home's value as well as a comparison with similar homes in the area
Home Values in the Area
Average Home Value in this Area
Purchase History
| Date | Buyer | Sale Price | Title Company |
|---|---|---|---|
| Greenberg Marc L | $173,000 | -- | |
| Boody Michael E | $169,900 | -- | |
| Somerset Custom Homes Inc | $54,000 | -- |
Source: Public Records
Mortgage History
| Date | Status | Borrower | Loan Amount |
|---|---|---|---|
| Previous Owner | Greenberg Marc L | $138,400 | |
| Previous Owner | Boody Michael E | $157,500 | |
| Closed | Somerset Custom Homes Inc | -- | |
| Closed | Greenberg Marc L | $34,600 |
Source: Public Records
Tax History Compared to Growth
Tax History
| Year | Tax Paid | Tax Assessment Tax Assessment Total Assessment is a certain percentage of the fair market value that is determined by local assessors to be the total taxable value of land and additions on the property. | Land | Improvement |
|---|---|---|---|---|
| 2024 | $4,417 | $94,750 | $19,430 | $75,320 |
| 2023 | $4,462 | $94,750 | $19,430 | $75,320 |
| 2022 | $4,426 | $71,680 | $14,700 | $56,980 |
| 2021 | $4,430 | $71,680 | $14,700 | $56,980 |
| 2020 | $4,246 | $71,680 | $14,700 | $56,980 |
| 2019 | $4,372 | $70,110 | $15,580 | $54,530 |
| 2018 | $4,374 | $70,110 | $15,580 | $54,530 |
| 2017 | $4,027 | $70,110 | $15,580 | $54,530 |
| 2016 | $4,115 | $59,920 | $13,300 | $46,620 |
| 2015 | $3,924 | $59,920 | $13,300 | $46,620 |
| 2014 | $3,757 | $59,920 | $13,300 | $46,620 |
| 2013 | $3,575 | $55,300 | $13,300 | $42,000 |
Source: Public Records
Map
Nearby Homes
- 1803 Wheatfield Way
- 6211 Spires Dr
- 2013 Weber Rd
- 6320 Ashford Dr
- 1140 Weber Rd
- 6108 Donna Jay Dr
- 6149 Century Farm Dr
- 6141 Brandywine Ct
- 5933 Firm Stance Dr
- 1064 Weber Rd
- 6077 Branch Hill Guinea Pike
- 1124 Clover Field Dr
- 1113 Clover Field Dr
- 1376 Barre Ln
- 6395 Barre Rd
- 1285 State Rte 28
- 6211 Cook Rd
- 6467 Smith Rd
- 1513 Charleston Ln
- 1289 Woodville Pike
- 6242 Deerhaven Ln
- 6246 Deerhaven Ln
- 123 Deerhaven Ln
- 120 Deerhaven Ln
- 6248 Deerhaven Ln
- 6240 Deerhaven Ln
- 6066 Weber Oaks Dr
- 6064 Weber Oaks Dr
- 6253 Deerhaven Ln
- 6068 Weber Oaks Dr
- 6250 Deerhaven Ln
- 6062 Weber Oaks Dr
- 6255 Deerhaven Ln
- 6238 Deerhaven Ln
- 6072 Weber Oaks Dr
- 6245 Deerhaven Ln
- 6060 Weber Oaks Dr
- 6257 Deerhaven Ln
- 6247 Deerhaven Ln
- 6251 Deerhaven Ln