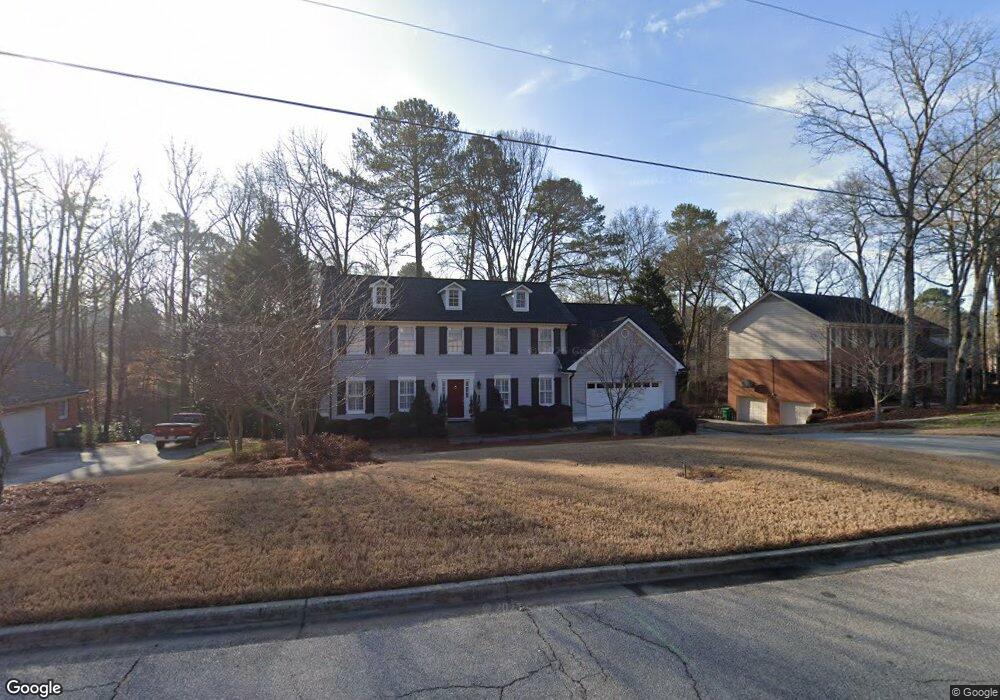
6246 Rosecommon Dr Unit I Norcross, GA 30092
Estimated Value: $623,000 - $660,000
4
Beds
3
Baths
3,019
Sq Ft
$211/Sq Ft
Est. Value
About This Home
This home is located at 6246 Rosecommon Dr Unit I, Norcross, GA 30092 and is currently estimated at $635,874, approximately $210 per square foot. 6246 Rosecommon Dr Unit I is a home located in Gwinnett County with nearby schools including Simpson Elementary School, Pinckneyville Middle School, and Norcross High School.
Ownership History
Date
Name
Owned For
Owner Type
Purchase Details
Closed on
Feb 7, 2024
Sold by
Jones Mark A
Bought by
Jones Lisa Pisano Tr and Jones Mark Anthony Tr
Current Estimated Value
Purchase Details
Closed on
Jan 29, 1999
Sold by
Bowen John S and Bowen Kimberly M
Bought by
Jones Mark A and Jones Lisa A
Home Financials for this Owner
Home Financials are based on the most recent Mortgage that was taken out on this home.
Original Mortgage
$206,150
Interest Rate
6.8%
Mortgage Type
New Conventional
Purchase Details
Closed on
Aug 23, 1996
Sold by
Kiel Jeffry A Carolyn
Bought by
Bowen John S Kimberly
Purchase Details
Closed on
Jan 12, 1994
Sold by
Nix Donald K
Bought by
Kiel Jeffry A Carolyn
Home Financials for this Owner
Home Financials are based on the most recent Mortgage that was taken out on this home.
Original Mortgage
$144,000
Interest Rate
7.1%
Create a Home Valuation Report for This Property
The Home Valuation Report is an in-depth analysis detailing your home's value as well as a comparison with similar homes in the area
Home Values in the Area
Average Home Value in this Area
Purchase History
| Date | Buyer | Sale Price | Title Company |
|---|---|---|---|
| Jones Lisa Pisano Tr | -- | -- | |
| Jones Mark A | $217,000 | -- | |
| Bowen John S Kimberly | $193,800 | -- | |
| Kiel Jeffry A Carolyn | $180,000 | -- |
Source: Public Records
Mortgage History
| Date | Status | Borrower | Loan Amount |
|---|---|---|---|
| Previous Owner | Jones Mark A | $206,150 | |
| Previous Owner | Kiel Jeffry A Carolyn | $144,000 | |
| Closed | Bowen John S Kimberly | $0 |
Source: Public Records
Tax History Compared to Growth
Tax History
| Year | Tax Paid | Tax Assessment Tax Assessment Total Assessment is a certain percentage of the fair market value that is determined by local assessors to be the total taxable value of land and additions on the property. | Land | Improvement |
|---|---|---|---|---|
| 2024 | $5,890 | $225,520 | $50,400 | $175,120 |
| 2023 | $5,890 | $198,240 | $44,000 | $154,240 |
| 2022 | $4,951 | $179,560 | $36,000 | $143,560 |
| 2021 | $4,382 | $147,400 | $35,520 | $111,880 |
| 2020 | $4,413 | $147,400 | $35,520 | $111,880 |
| 2019 | $4,306 | $147,160 | $30,000 | $117,160 |
| 2018 | $4,322 | $147,160 | $30,000 | $117,160 |
| 2016 | $3,862 | $127,640 | $24,000 | $103,640 |
| 2015 | $3,896 | $127,640 | $24,000 | $103,640 |
| 2014 | -- | $127,640 | $24,000 | $103,640 |
Source: Public Records
Map
Nearby Homes
- 6387 Rosecommon Dr NW
- 3710 Wedgewood Chase Unit 22
- 6423 Deerings Ln
- 3835 Spalding Bluff Dr
- 6433 Deerings Ln
- 6307 Deerings Hollow
- 4019 Deerings Dr Unit 42
- 6550 Deerings Ln
- 6501 Deerings Ln Unit 6501
- 6296 Courtside Dr
- 6538 Deerings Ln
- 3922 Glen Meadow Dr
- 6530 Deerings Ln
- 3810 Courtside Terrace
- 6509 Deerings Ln
- 6169 Poplar Bluff Cir
- 3875 Grand Forest Dr
- 6236 Rosecommon Dr
- 6266 Rosecommon Dr Unit 1
- 6264 Applegate Ct
- 6226 Rosecommon Dr
- 6276 Rosecommon Dr
- 6276 Rosecommon Dr NW
- 6274 Applegate Ct
- 6247 Rosecommon Dr
- 6237 Rosecommon Dr
- 6255 Applegate Ct
- 6257 Rosecommon Dr
- 6286 Rosecommon Dr
- 6227 Rosecommon Dr Unit 1
- 3934 Heathwood Ln
- 6216 Rosecommon Dr
- 6267 Rosecommon Dr
- 3944 Heathwood Ln Unit I
- 6277 Rosecommon Dr Unit 2
- 6217 Rosecommon Dr
- 6265 Applegate Ct