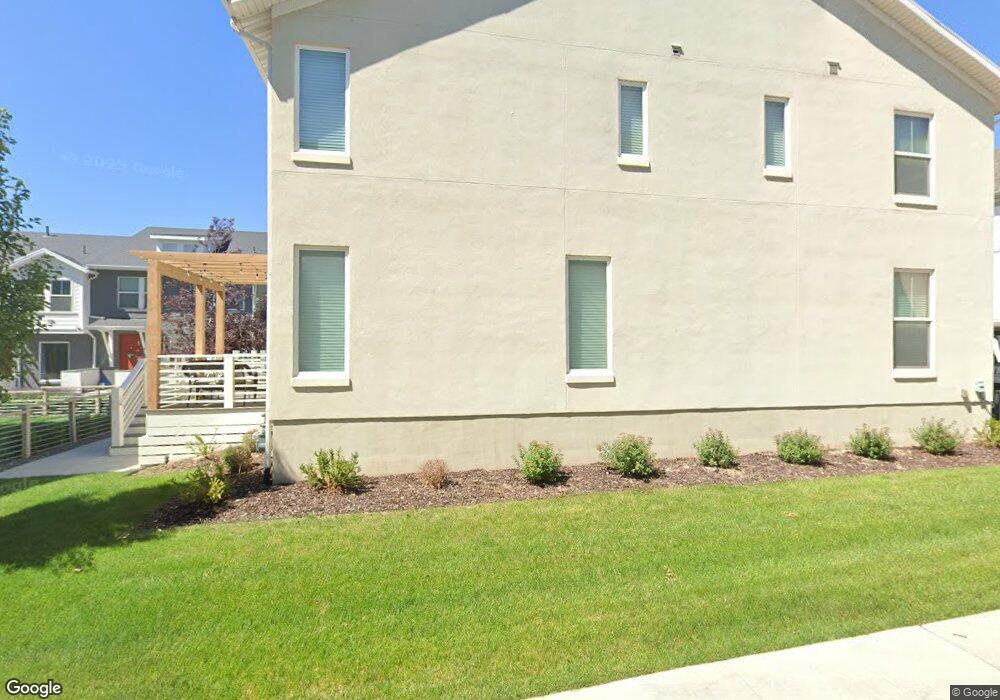
6246 W Birch Run Rd Unit 431 South Jordan, UT 84009
Daybreak NeighborhoodEstimated Value: $405,016 - $417,000
3
Beds
2
Baths
1,337
Sq Ft
$306/Sq Ft
Est. Value
About This Home
This home is located at 6246 W Birch Run Rd Unit 431, South Jordan, UT 84009 and is currently estimated at $409,754, approximately $306 per square foot. 6246 W Birch Run Rd Unit 431 is a home located in Salt Lake County with nearby schools including Mountain Creek Middle School, Herriman High School, and Advantage Arts Academy.
Ownership History
Date
Name
Owned For
Owner Type
Purchase Details
Closed on
Aug 13, 2020
Sold by
Berg Frederick and Berg Karin J
Bought by
Racine Cole and Chynoweth Mckenna
Current Estimated Value
Home Financials for this Owner
Home Financials are based on the most recent Mortgage that was taken out on this home.
Original Mortgage
$284,747
Outstanding Balance
$252,591
Interest Rate
3%
Mortgage Type
FHA
Estimated Equity
$157,163
Purchase Details
Closed on
Nov 5, 2018
Sold by
Destination Homes Inc
Bought by
Berg Karin J and Berg Frederick
Home Financials for this Owner
Home Financials are based on the most recent Mortgage that was taken out on this home.
Original Mortgage
$211,900
Interest Rate
4.49%
Mortgage Type
Adjustable Rate Mortgage/ARM
Purchase Details
Closed on
Mar 14, 2018
Sold by
Vp Daybreak Operations Llc
Bought by
Destination Homes Inc A Utah Corporatijo
Create a Home Valuation Report for This Property
The Home Valuation Report is an in-depth analysis detailing your home's value as well as a comparison with similar homes in the area
Home Values in the Area
Average Home Value in this Area
Purchase History
| Date | Buyer | Sale Price | Title Company |
|---|---|---|---|
| Racine Cole | -- | Real Advantage Ttl Ins Agcy | |
| Berg Karin J | -- | Stewart Title Ins Agcy Of Ut | |
| Destination Homes Inc A Utah Corporatijo | -- | First American Title |
Source: Public Records
Mortgage History
| Date | Status | Borrower | Loan Amount |
|---|---|---|---|
| Open | Racine Cole | $284,747 | |
| Previous Owner | Berg Karin J | $211,900 |
Source: Public Records
Tax History Compared to Growth
Tax History
| Year | Tax Paid | Tax Assessment Tax Assessment Total Assessment is a certain percentage of the fair market value that is determined by local assessors to be the total taxable value of land and additions on the property. | Land | Improvement |
|---|---|---|---|---|
| 2025 | $2,131 | $413,800 | $50,700 | $363,100 |
| 2024 | $2,131 | $404,600 | $49,200 | $355,400 |
| 2023 | $2,215 | $396,800 | $47,800 | $349,000 |
| 2022 | $2,291 | $402,200 | $46,800 | $355,400 |
| 2021 | $1,864 | $300,300 | $36,100 | $264,200 |
| 2020 | $1,769 | $267,100 | $34,000 | $233,100 |
| 2019 | $1,744 | $258,900 | $34,000 | $224,900 |
| 2018 | $428 | $34,800 | $34,800 | $0 |
| 2017 | $0 | $0 | $0 | $0 |
Source: Public Records
Map
Nearby Homes
- 11228 S Old Bridge Rd
- 6158 W South Jordan Pkwy
- 6178 W Sugarcane Dr
- 11268 S Holly Springs Dr
- 11383 S New Bern Way
- 6257 W Birch Run Rd Unit 125
- 6317 W South Jordan Pkwy
- 6241 W Arranmore Dr
- 6101 W Lake Ave
- 11283 S Willow Walk Dr
- 11346 S Willow Walk Dr
- 6372 W Birch Run Rd
- 6189 W Lake Ave
- 6331 W Copper Hawk Dr
- 6067 W Whistle Stop Rd
- 6427 W Arranmore Dr
- 11413 S Kitty Hawk Rd
- 6228 W Copper Hawk Dr
- 5957 W Lake Ave
- 6156 W Poplar View Dr
- 6242 W Birch Run Rd Unit 429
- 6242 W Birch Run Rd
- 6218 W Birch Run Rd
- 6214 W Birch Run Rd Unit 441
- 6214 W Birch Run Rd
- 6216 W Birch Run Rd
- 6216 W Birch Run Rd Unit 442
- 6212 W Birch Run Rd
- 6238 W Birch Run Rd Unit 428
- 6238 W Birch Run Rd
- 6222 W Birch Run Rd
- 6208 W Birch Run Rd Unit 439
- 6236 W Birch Run Rd
- 11331 S Holly Springs Dr
- 11331 S Holly Springs Dr Unit 417
- 6221 W South Jordan Pkwy Unit 220
- 6206 W Birch Run Rd Unit 438
- 6224 W Birch Run Rd Unit 434
- 6224 W Birch Run Rd
- 6234 W Birch Run Rd