6248 N Shadow Hill Way Loveland, OH 45140
Outer Loveland NeighborhoodEstimated Value: $416,000 - $445,000
4
Beds
3
Baths
2,362
Sq Ft
$180/Sq Ft
Est. Value
About This Home
This home is located at 6248 N Shadow Hill Way, Loveland, OH 45140 and is currently estimated at $424,419, approximately $179 per square foot. 6248 N Shadow Hill Way is a home located in Clermont County with nearby schools including Milford Senior High School, Milford Christian Academy, and St. Columban Elementary School.
Ownership History
Date
Name
Owned For
Owner Type
Purchase Details
Closed on
Aug 6, 2021
Sold by
Dayton Jeffrey M and Dayton Megan M
Bought by
Kane Jonathan and Kane Kaitlin
Current Estimated Value
Home Financials for this Owner
Home Financials are based on the most recent Mortgage that was taken out on this home.
Original Mortgage
$240,000
Outstanding Balance
$218,560
Interest Rate
3%
Mortgage Type
New Conventional
Estimated Equity
$205,859
Purchase Details
Closed on
Mar 9, 2012
Sold by
Palmer Amanda L and Palmer Matthew
Bought by
Dayton Jeffrey M and Dayton Bruce A
Home Financials for this Owner
Home Financials are based on the most recent Mortgage that was taken out on this home.
Original Mortgage
$204,763
Interest Rate
3.86%
Mortgage Type
FHA
Purchase Details
Closed on
Oct 31, 2006
Sold by
Waeber Kenneth R and Waeber Jill B
Bought by
Palmer Matthew and Palmer Amanda L
Purchase Details
Closed on
Sep 1, 1987
Create a Home Valuation Report for This Property
The Home Valuation Report is an in-depth analysis detailing your home's value as well as a comparison with similar homes in the area
Home Values in the Area
Average Home Value in this Area
Purchase History
| Date | Buyer | Sale Price | Title Company |
|---|---|---|---|
| Kane Jonathan | $300,000 | None Available | |
| Dayton Jeffrey M | $219,000 | Attorney | |
| Palmer Matthew | $227,000 | Chicago Title Insurance | |
| -- | $137,200 | -- |
Source: Public Records
Mortgage History
| Date | Status | Borrower | Loan Amount |
|---|---|---|---|
| Open | Kane Jonathan | $240,000 | |
| Previous Owner | Dayton Jeffrey M | $204,763 |
Source: Public Records
Tax History Compared to Growth
Tax History
| Year | Tax Paid | Tax Assessment Tax Assessment Total Assessment is a certain percentage of the fair market value that is determined by local assessors to be the total taxable value of land and additions on the property. | Land | Improvement |
|---|---|---|---|---|
| 2024 | $4,784 | $105,010 | $19,430 | $85,580 |
| 2023 | $4,834 | $105,010 | $19,430 | $85,580 |
| 2022 | $5,506 | $91,070 | $15,400 | $75,670 |
| 2021 | $5,512 | $91,070 | $15,400 | $75,670 |
| 2020 | $5,283 | $91,070 | $15,400 | $75,670 |
| 2019 | $5,176 | $84,710 | $15,300 | $69,410 |
| 2018 | $5,178 | $84,710 | $15,300 | $69,410 |
| 2017 | $4,949 | $84,710 | $15,300 | $69,410 |
| 2016 | $4,949 | $73,640 | $13,300 | $60,340 |
| 2015 | $4,617 | $73,640 | $13,300 | $60,340 |
| 2014 | $4,617 | $73,640 | $13,300 | $60,340 |
| 2013 | $4,579 | $70,840 | $14,000 | $56,840 |
Source: Public Records
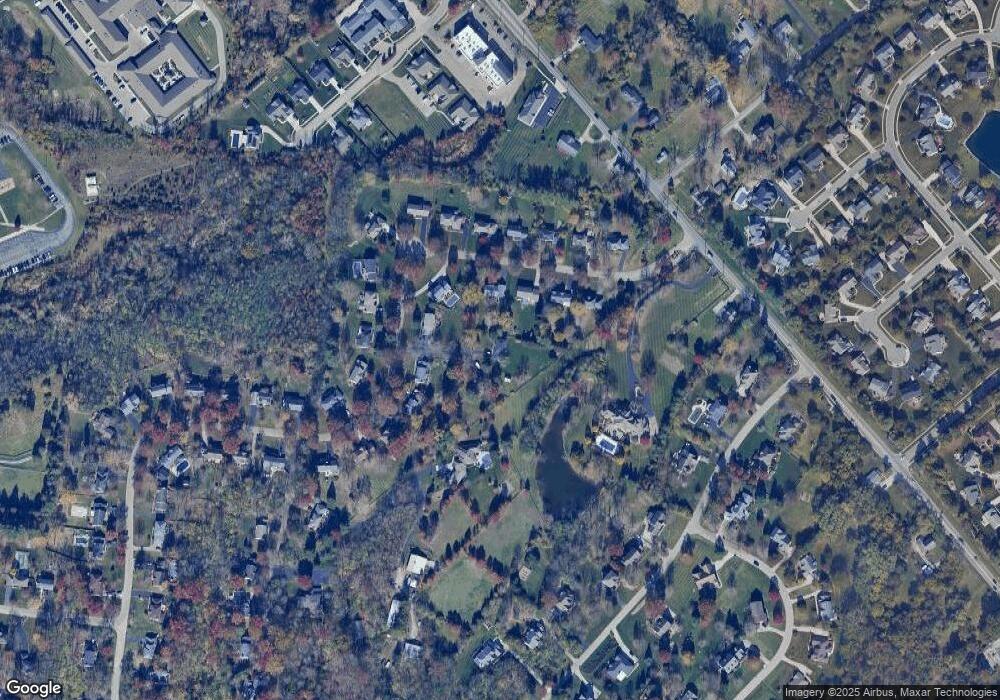
Map
Nearby Homes
- 1331 Harbor Cove
- 709 Middleton Way
- 6381 Waverly Hill Ln
- 802 Andrea Dr
- 6469 Brittany Ln
- 6272 Price Rd
- 729 Harper Ln
- 6379 Derbyshire Ln
- 962 Paul Vista Dr
- 603 Wards Corner Rd
- 1113 Clover Field Dr
- 6022 Scotch Pine Dr
- 1146 Clover Field Dr
- 762 Wards Corner Rd
- 6557 Oasis Dr
- 6149 Century Farm Dr
- 1152 Diekmeyer Ln
- 709 Deer Trail Ct
- 1706 Cottontail Dr
- 5937 Firm Stance Dr
- 6248 N Shadowhill Way
- 6246 N Shadow Hill Way
- 6256 N Shadow Hill Way
- 6254 N Shadow Hill Way
- 6258 N Shadow Hill Way
- 6250 N Shadow Hill Way
- 6244 N Shadow Hill Way
- 6252 N Shadow Hill Way
- 6242 N Shadow Hill Way
- 6260 N Shadow Hill Way
- 750 Deerwood Ln
- 6251 N Shadowhill Way
- 6251 N Shadow Hill Way
- 6253 N Shadow Hill Way
- 6240 N Shadow Hill Way
- 6249 N Shadow Hill Way
- 6240 N Shadowhill Way
- 848 Rolfes Fields Ln
- 6255 N Shadow Hill Way
- 6235 N Shadow Hill Way