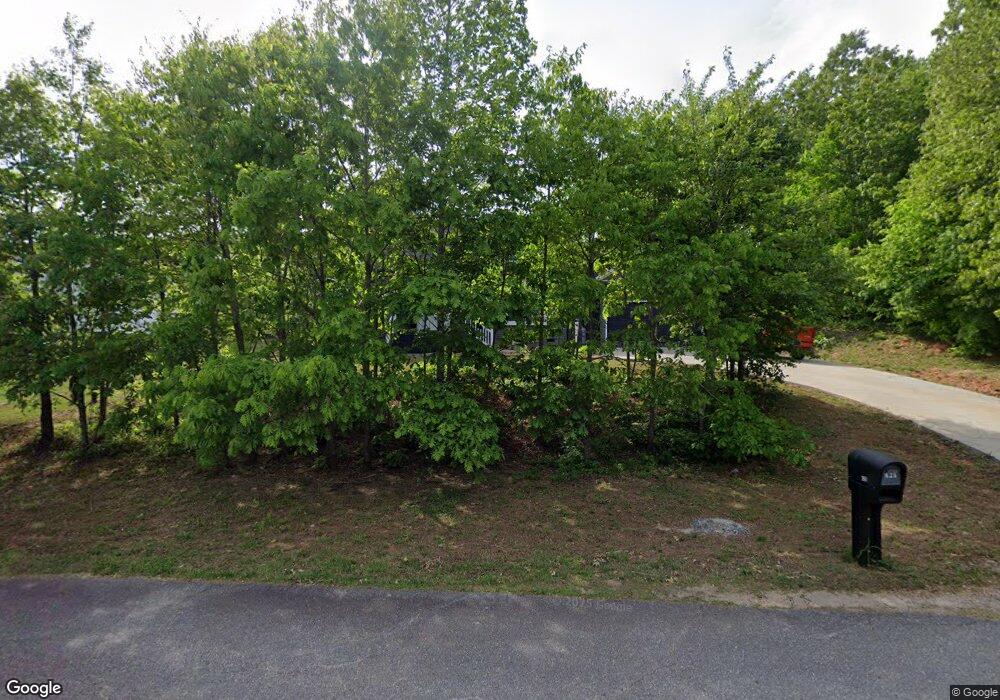
625 34th St NE Unit 19 Conover, NC 28613
Estimated Value: $280,000 - $388,000
3
Beds
2
Baths
2,587
Sq Ft
$133/Sq Ft
Est. Value
About This Home
This home is located at 625 34th St NE Unit 19, Conover, NC 28613 and is currently estimated at $344,000, approximately $132 per square foot. 625 34th St NE Unit 19 is a home located in Catawba County with nearby schools including Saint Stephens Elementary School, Saint Stephens High School, and Harry M. Arndt Middle School.
Ownership History
Date
Name
Owned For
Owner Type
Purchase Details
Closed on
Feb 8, 2021
Sold by
Burns Bryan Curtis and Burns Pamela Kay
Bought by
Acuff Lisa and 34Th St Ne Landtrust
Current Estimated Value
Purchase Details
Closed on
Jul 18, 2016
Sold by
Shook Lonnie Dale and Shook Mary Sisk
Bought by
Burns Brian Curtis and Burns Pamela Kay
Purchase Details
Closed on
Nov 8, 2012
Sold by
Bank Of Granite
Bought by
Shook Lonnie Dale and Shook Mary Sisk
Purchase Details
Closed on
Jul 12, 2011
Sold by
Kks Builders Inc
Bought by
Bank Of Granite
Purchase Details
Closed on
Nov 9, 2006
Sold by
Keller James A and Keller Mildred D
Bought by
Kks Builders Inc
Home Financials for this Owner
Home Financials are based on the most recent Mortgage that was taken out on this home.
Original Mortgage
$160,000
Interest Rate
6.27%
Mortgage Type
Purchase Money Mortgage
Create a Home Valuation Report for This Property
The Home Valuation Report is an in-depth analysis detailing your home's value as well as a comparison with similar homes in the area
Home Values in the Area
Average Home Value in this Area
Purchase History
| Date | Buyer | Sale Price | Title Company |
|---|---|---|---|
| Acuff Lisa | -- | None Available | |
| 34Th St Ne Landtrust | -- | None Listed On Document | |
| Burns Brian Curtis | $13,500 | Attorney | |
| Shook Lonnie Dale | $5,000 | None Available | |
| Bank Of Granite | $4,100 | None Available | |
| Kks Builders Inc | -- | None Available |
Source: Public Records
Mortgage History
| Date | Status | Borrower | Loan Amount |
|---|---|---|---|
| Previous Owner | Kks Builders Inc | $160,000 |
Source: Public Records
Tax History Compared to Growth
Tax History
| Year | Tax Paid | Tax Assessment Tax Assessment Total Assessment is a certain percentage of the fair market value that is determined by local assessors to be the total taxable value of land and additions on the property. | Land | Improvement |
|---|---|---|---|---|
| 2025 | $2,178 | $416,900 | $19,700 | $397,200 |
| 2024 | $2,178 | $416,900 | $19,700 | $397,200 |
| 2023 | $2,095 | $416,900 | $19,700 | $397,200 |
| 2022 | $1,427 | $205,300 | $17,700 | $187,600 |
| 2021 | $1,427 | $205,300 | $17,700 | $187,600 |
| 2020 | $1,427 | $205,300 | $0 | $0 |
| 2019 | $1,427 | $205,300 | $0 | $0 |
| 2018 | $1,368 | $196,900 | $17,900 | $179,000 |
| 2017 | $124 | $0 | $0 | $0 |
| 2016 | $119 | $0 | $0 | $0 |
| 2015 | -- | $17,900 | $17,900 | $0 |
| 2014 | -- | $22,700 | $22,700 | $0 |
Source: Public Records
Map
Nearby Homes
- V/L 33rd St NE Unit 15
- 3233 6th Ave NE
- 921 Spencer Rd NE
- 805 32nd Street Dr NE
- 350 Spencer Rd NE
- 3501 Overbrook Dr
- 952 30th St NE
- 1524 29th St SE
- 1530 29th St SE
- 1328 32nd Street Ct NE
- 3395 Danial St
- 1212 31st St NE
- 1260 31st St NE
- 2792 5th Ave NE
- Vienna Plan at Walnut Reserve
- Kirkwood Plan at Walnut Reserve
- Dallas Plan at Walnut Reserve
- Finley Plan at Walnut Reserve
- Paisley Plan at Walnut Reserve
- Roswell Plan at Walnut Reserve
- 625 34th St NE
- 615 34th St NE
- 626 33rd Street Place NE
- 616 33rd Street Place NE
- 624 34th St NE
- 614 34th St NE
- 605 34th St NE
- 702 33rd St NE
- 604 34th St NE
- 30 33rd St NE
- Lot 10/D 33rd St NE
- 811 33rd St NE
- Lot 15 33rd St NE Unit 15-D
- Lot 13 33rd St NE Unit 13D
- 3243 6th Ave NE
- 613 35th St NE
- 3326 6th Ave NE
- 3336 6th Ave NE
- 3316 6th Ave NE
- 627 33rd Street Place NE