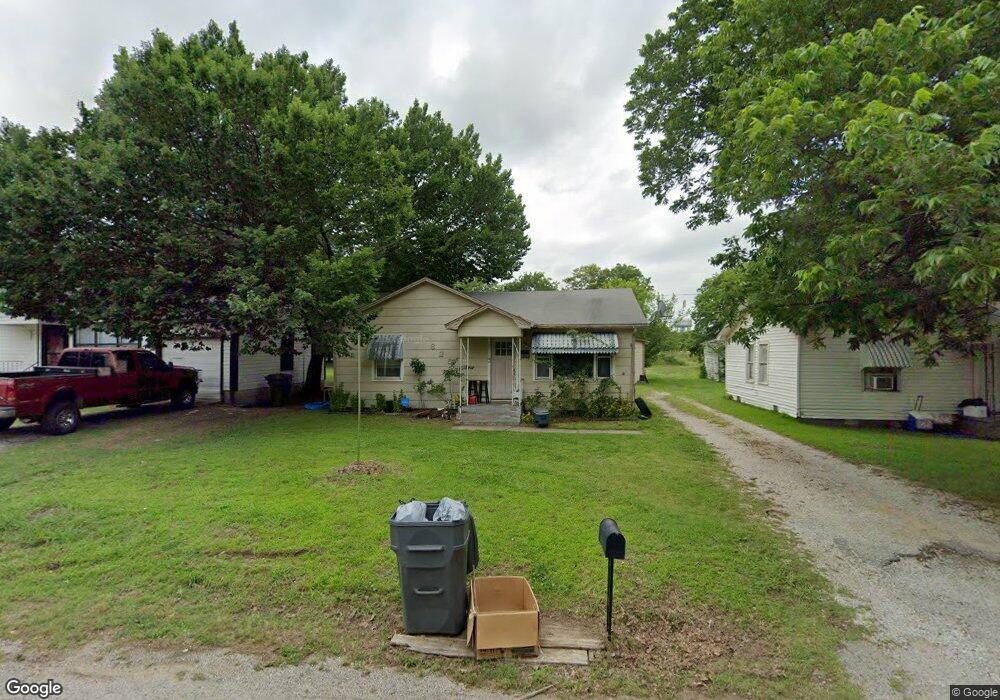
625 A St SE Ardmore, OK 73401
Estimated Value: $89,695 - $96,000
2
Beds
1
Bath
1,000
Sq Ft
$93/Sq Ft
Est. Value
About This Home
This home is located at 625 A St SE, Ardmore, OK 73401 and is currently estimated at $93,174, approximately $93 per square foot. 625 A St SE is a home located in Carter County with nearby schools including Jefferson Elementary School, Ardmore Middle School, and Ardmore High School.
Ownership History
Date
Name
Owned For
Owner Type
Purchase Details
Closed on
Mar 23, 2011
Sold by
Secretary Of Housing And Urban Developme
Bought by
Neher Martin Scott and Neher Martin Brett
Current Estimated Value
Home Financials for this Owner
Home Financials are based on the most recent Mortgage that was taken out on this home.
Original Mortgage
$25,008
Interest Rate
5.04%
Mortgage Type
Unknown
Purchase Details
Closed on
Sep 21, 2005
Sold by
Carter Jim C
Bought by
Mcdaniels Jenny
Home Financials for this Owner
Home Financials are based on the most recent Mortgage that was taken out on this home.
Original Mortgage
$48,669
Interest Rate
5.88%
Mortgage Type
FHA
Purchase Details
Closed on
Aug 31, 2001
Sold by
Keith Fern
Bought by
Carter Jimmie C
Create a Home Valuation Report for This Property
The Home Valuation Report is an in-depth analysis detailing your home's value as well as a comparison with similar homes in the area
Purchase History
| Date | Buyer | Sale Price | Title Company |
|---|---|---|---|
| Neher Martin Scott | -- | -- | |
| Mcdaniels Jenny | $49,500 | -- | |
| Carter Jimmie C | $33,500 | -- |
Source: Public Records
Mortgage History
| Date | Status | Borrower | Loan Amount |
|---|---|---|---|
| Closed | Neher Martin Scott | $25,008 | |
| Previous Owner | Mcdaniels Jenny | $48,669 |
Source: Public Records
Tax History
| Year | Tax Paid | Tax Assessment Tax Assessment Total Assessment is a certain percentage of the fair market value that is determined by local assessors to be the total taxable value of land and additions on the property. | Land | Improvement |
|---|---|---|---|---|
| 2025 | $475 | $4,766 | $900 | $3,866 |
| 2024 | $476 | $4,539 | $900 | $3,639 |
| 2023 | $453 | $4,323 | $900 | $3,423 |
| 2022 | $394 | $4,117 | $900 | $3,217 |
| 2021 | $396 | $3,921 | $900 | $3,021 |
| 2020 | $402 | $4,041 | $480 | $3,561 |
| 2019 | $392 | $4,041 | $480 | $3,561 |
| 2018 | $399 | $4,041 | $480 | $3,561 |
| 2017 | $386 | $4,218 | $480 | $3,738 |
| 2016 | $402 | $4,312 | $480 | $3,832 |
| 2015 | $334 | $4,344 | $239 | $4,105 |
| 2014 | $417 | $4,659 | $239 | $4,420 |
Source: Public Records
Map
Nearby Homes