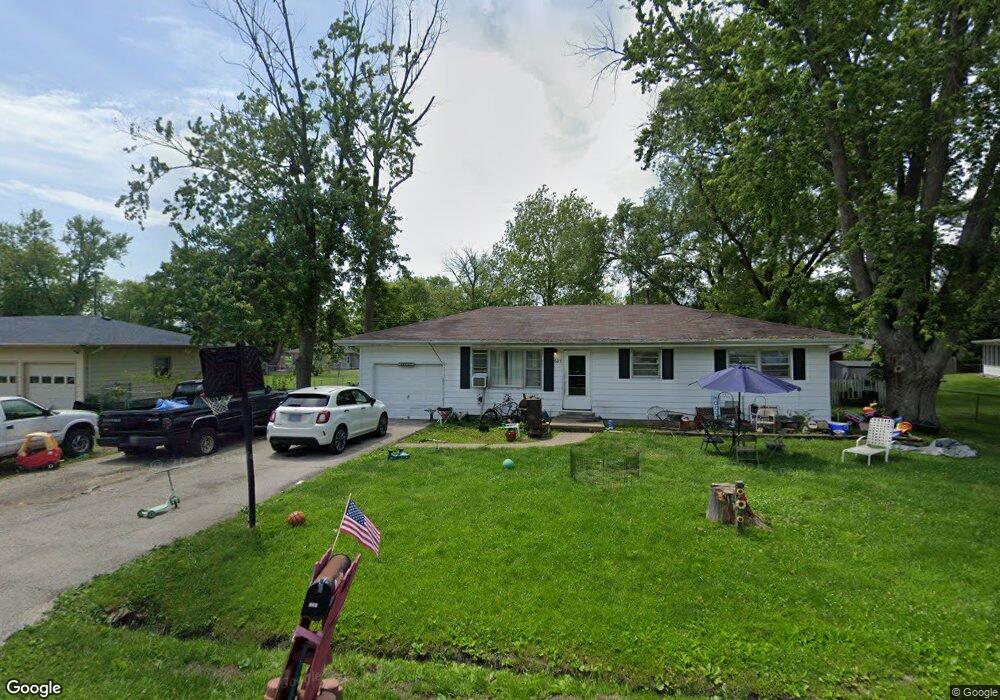
625 Benton Dr Mount Zion, IL 62549
Estimated Value: $119,000 - $149,000
3
Beds
2
Baths
1,040
Sq Ft
$127/Sq Ft
Est. Value
About This Home
This home is located at 625 Benton Dr, Mount Zion, IL 62549 and is currently estimated at $132,551, approximately $127 per square foot. 625 Benton Dr is a home located in Macon County with nearby schools including McGaughey Elementary School, Mt. Zion Intermediate School, and Mt. Zion Elementary School.
Ownership History
Date
Name
Owned For
Owner Type
Purchase Details
Closed on
Jul 14, 2017
Sold by
Moody Ronald E and Moody Kavn S
Bought by
Moody Thomas L and Moody Lana C
Current Estimated Value
Purchase Details
Closed on
May 27, 2008
Sold by
Deutsche Bank National Trust Company
Bought by
Moddy Ronald and Moddy Karen
Home Financials for this Owner
Home Financials are based on the most recent Mortgage that was taken out on this home.
Original Mortgage
$40,500
Outstanding Balance
$25,989
Interest Rate
6.05%
Mortgage Type
New Conventional
Estimated Equity
$106,562
Purchase Details
Closed on
Apr 15, 2008
Sold by
Dawson Jerry
Bought by
Deutsche Bank National Trust Company
Home Financials for this Owner
Home Financials are based on the most recent Mortgage that was taken out on this home.
Original Mortgage
$40,500
Outstanding Balance
$25,989
Interest Rate
6.05%
Mortgage Type
New Conventional
Estimated Equity
$106,562
Purchase Details
Closed on
Feb 1, 2001
Create a Home Valuation Report for This Property
The Home Valuation Report is an in-depth analysis detailing your home's value as well as a comparison with similar homes in the area
Home Values in the Area
Average Home Value in this Area
Purchase History
| Date | Buyer | Sale Price | Title Company |
|---|---|---|---|
| Moody Thomas L | -- | None Available | |
| Moddy Ronald | $45,000 | None Available | |
| Deutsche Bank National Trust Company | -- | None Available | |
| -- | $67,500 | -- |
Source: Public Records
Mortgage History
| Date | Status | Borrower | Loan Amount |
|---|---|---|---|
| Open | Moddy Ronald | $40,500 |
Source: Public Records
Tax History
| Year | Tax Paid | Tax Assessment Tax Assessment Total Assessment is a certain percentage of the fair market value that is determined by local assessors to be the total taxable value of land and additions on the property. | Land | Improvement |
|---|---|---|---|---|
| 2024 | $2,351 | $36,115 | $4,839 | $31,276 |
| 2023 | $2,090 | $33,590 | $4,501 | $29,089 |
| 2022 | $1,974 | $31,860 | $4,269 | $27,591 |
| 2021 | $1,885 | $29,848 | $4,000 | $25,848 |
| 2020 | $1,499 | $25,575 | $4,827 | $20,748 |
| 2019 | $1,499 | $25,575 | $4,827 | $20,748 |
| 2018 | $1,439 | $24,922 | $4,704 | $20,218 |
| 2017 | $2,095 | $24,443 | $4,614 | $19,829 |
| 2016 | $2,078 | $24,018 | $4,534 | $19,484 |
| 2015 | $2,012 | $23,780 | $4,489 | $19,291 |
| 2014 | $1,940 | $23,780 | $4,489 | $19,291 |
| 2013 | $1,962 | $23,780 | $4,489 | $19,291 |
Source: Public Records
Map
Nearby Homes
- 850 Kirk Dr
- 645 Pearl Ct
- 210 Bell Ct
- 300 South Dr
- Lot 20 Jeffrey Ln
- 524 Elm St
- 635 Mill St
- 355 S Henderson St
- 625 Fawn Ct
- 645 S Antler Dr
- 325 W Wildwood Dr
- 3930 S Mount Zion Rd
- Lot 32 Janine Way
- Lot 3 Fletcher Ln
- Lot 1 Fletcher Ln
- 1065 Country Manor
- 1354 Kays Ct
- Lot 27 Tara Pkwy
- Lot 31 Woodbine Park Prairie Estates
- 10A Kimm Ln
Your Personal Tour Guide
Ask me questions while you tour the home.