625 Bridge St Lafayette, OR 97127
Lafayette NeighborhoodEstimated Value: $348,796 - $423,000
3
Beds
1
Bath
1,000
Sq Ft
$381/Sq Ft
Est. Value
About This Home
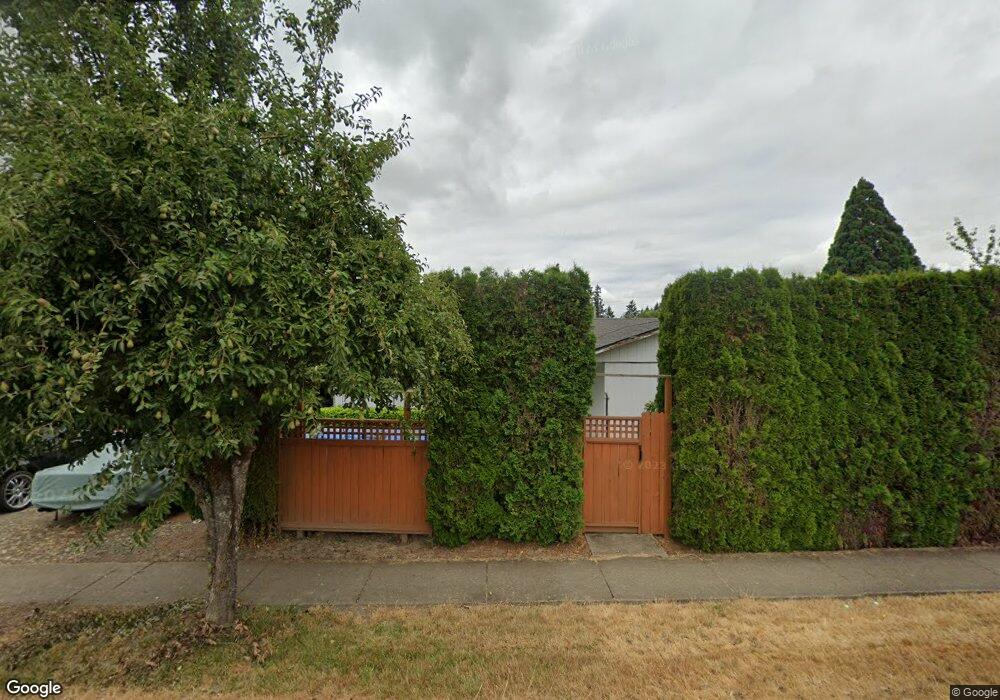
This home is located at 625 Bridge St, Lafayette, OR 97127 and is currently estimated at $381,449, approximately $381 per square foot. 625 Bridge St is a home located in Yamhill County with nearby schools including Wascher Elementary School, Patton Middle School, and McMinnville High School.
Ownership History
Date
Name
Owned For
Owner Type
Purchase Details
Closed on
Sep 1, 2004
Sold by
Pierce Patrick B and Pierce Shelley D
Bought by
Ojeda Ramando
Current Estimated Value
Home Financials for this Owner
Home Financials are based on the most recent Mortgage that was taken out on this home.
Original Mortgage
$105,600
Outstanding Balance
$54,404
Interest Rate
6.7%
Mortgage Type
Purchase Money Mortgage
Estimated Equity
$327,045
Create a Home Valuation Report for This Property
The Home Valuation Report is an in-depth analysis detailing your home's value as well as a comparison with similar homes in the area
Home Values in the Area
Average Home Value in this Area
Purchase History
| Date | Buyer | Sale Price | Title Company |
|---|---|---|---|
| Ojeda Ramando | $132,000 | Ticor Title Insurance Co |
Source: Public Records
Mortgage History
| Date | Status | Borrower | Loan Amount |
|---|---|---|---|
| Open | Ojeda Ramando | $105,600 | |
| Closed | Ojeda Ramando | $26,400 |
Source: Public Records
Tax History Compared to Growth
Tax History
| Year | Tax Paid | Tax Assessment Tax Assessment Total Assessment is a certain percentage of the fair market value that is determined by local assessors to be the total taxable value of land and additions on the property. | Land | Improvement |
|---|---|---|---|---|
| 2025 | $2,286 | $156,008 | -- | -- |
| 2024 | $2,226 | $151,464 | -- | -- |
| 2023 | $2,167 | $147,052 | $0 | $0 |
| 2022 | $2,124 | $142,769 | $0 | $0 |
| 2021 | $2,057 | $138,611 | $0 | $0 |
| 2020 | $2,006 | $134,574 | $0 | $0 |
| 2019 | $1,960 | $130,654 | $0 | $0 |
| 2018 | $1,796 | $126,849 | $0 | $0 |
| 2017 | $1,746 | $123,154 | $0 | $0 |
| 2016 | $1,711 | $119,567 | $0 | $0 |
| 2015 | $1,661 | $116,086 | $0 | $0 |
| 2014 | $1,544 | $108,086 | $0 | $0 |
Source: Public Records
Map
Nearby Homes