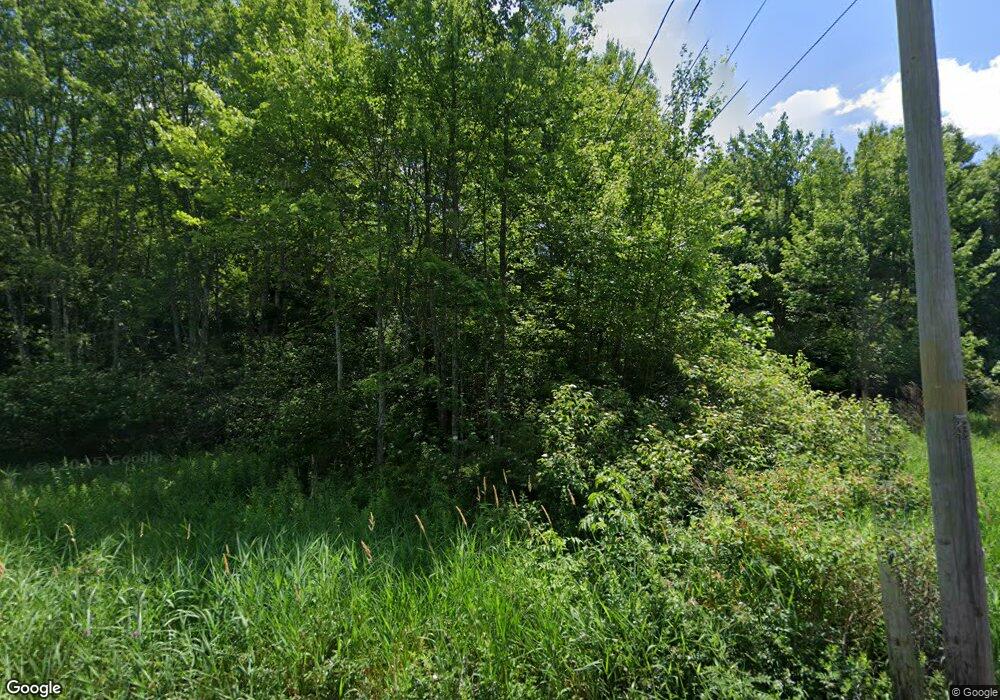
625 Crescent St East Bridgewater, MA 02333
Estimated Value: $657,970 - $689,000
3
Beds
2
Baths
2,000
Sq Ft
$337/Sq Ft
Est. Value
About This Home
This home is located at 625 Crescent St, East Bridgewater, MA 02333 and is currently estimated at $673,243, approximately $336 per square foot. 625 Crescent St is a home located in Plymouth County with nearby schools including Central Elementary School, Gordon W Mitchell Middle School, and East Bridgewater Jr./Sr. High School.
Ownership History
Date
Name
Owned For
Owner Type
Purchase Details
Closed on
Jul 18, 2005
Sold by
Kisielius Robert J
Bought by
Goldman Mark E and Goldman Nancy M
Current Estimated Value
Home Financials for this Owner
Home Financials are based on the most recent Mortgage that was taken out on this home.
Original Mortgage
$279,900
Outstanding Balance
$146,206
Interest Rate
5.67%
Mortgage Type
Purchase Money Mortgage
Estimated Equity
$527,037
Purchase Details
Closed on
Sep 17, 1998
Sold by
Mccormack Eric S and Mccormack Carol A
Bought by
Kistielius John A and Kisielius Alice
Purchase Details
Closed on
Dec 23, 1994
Sold by
A&J Rt and Regas James H
Bought by
Mccormacka Eric S and Mccormack Carol A
Create a Home Valuation Report for This Property
The Home Valuation Report is an in-depth analysis detailing your home's value as well as a comparison with similar homes in the area
Home Values in the Area
Average Home Value in this Area
Purchase History
| Date | Buyer | Sale Price | Title Company |
|---|---|---|---|
| Goldman Mark E | $349,900 | -- | |
| Kistielius John A | $172,500 | -- | |
| Mccormacka Eric S | $136,200 | -- |
Source: Public Records
Mortgage History
| Date | Status | Borrower | Loan Amount |
|---|---|---|---|
| Open | Mccormacka Eric S | $279,900 | |
| Previous Owner | Mccormacka Eric S | $304,000 | |
| Previous Owner | Mccormacka Eric S | $275,000 |
Source: Public Records
Tax History Compared to Growth
Tax History
| Year | Tax Paid | Tax Assessment Tax Assessment Total Assessment is a certain percentage of the fair market value that is determined by local assessors to be the total taxable value of land and additions on the property. | Land | Improvement |
|---|---|---|---|---|
| 2025 | $8,037 | $587,900 | $195,700 | $392,200 |
| 2024 | $7,889 | $570,000 | $188,200 | $381,800 |
| 2023 | $7,686 | $531,900 | $188,200 | $343,700 |
| 2022 | $7,268 | $465,900 | $171,200 | $294,700 |
| 2021 | $7,013 | $411,300 | $164,500 | $246,800 |
| 2020 | $6,887 | $398,300 | $158,200 | $240,100 |
| 2019 | $6,720 | $382,700 | $151,200 | $231,500 |
| 2018 | $6,640 | $369,700 | $151,200 | $218,500 |
| 2017 | $6,493 | $354,800 | $144,200 | $210,600 |
| 2016 | $6,289 | $346,300 | $144,200 | $202,100 |
| 2015 | $6,184 | $348,200 | $143,200 | $205,000 |
| 2014 | $5,918 | $340,700 | $140,200 | $200,500 |
Source: Public Records
Map
Nearby Homes
- 1993 Washington St
- 71 Stonegate Dr
- 1247 Central St
- 2045 Washington St
- 587 Bridge St
- 182 Crystal Water Dr Unit 182
- 28 Brookbend Way E
- 170 Elm St
- 26 Meadowbrook Dr
- 94 Pond St
- 217 Crystal Water Dr
- 29 Hayes Rd
- 22 Hudson St
- 78 Crystal Water Dr
- 1 Simmons Place
- 936 Central St
- 10 Eliab Latham Way
- 844 Washington St
- 5 Della Way
- 9 Daisy Ln
- 635 Crescent St
- 603 Crescent St
- 614 Crescent St
- 645 Crescent St
- 622 Crescent St
- 632 Crescent St
- 599 Crescent St
- 588 Crescent St
- 5 Hereford Ln
- 655 Crescent St
- 656 Crescent St
- 580 Crescent St
- 11 Hereford Ln
- 668 Crescent St
- 564 Crescent St
- 671 Crescent St
- 2 Hereford Ln
- 680 Crescent St
- 17 Hereford Ln
- 522 Crescent St
