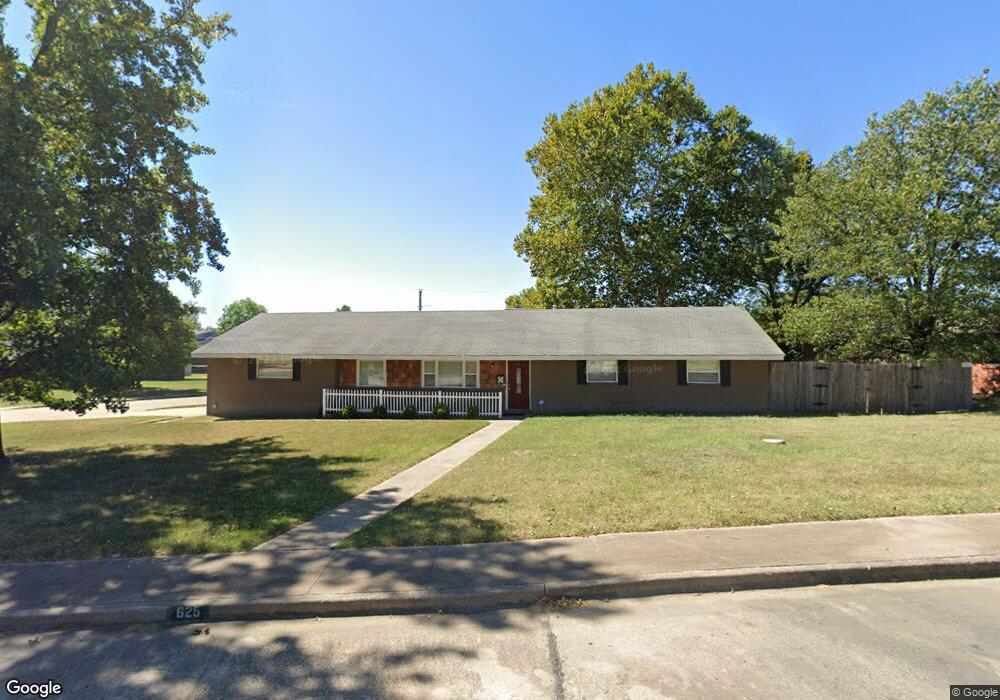
625 Crown Dr Bartlesville, OK 74006
Estimated Value: $169,000 - $196,000
3
Beds
3
Baths
1,748
Sq Ft
$106/Sq Ft
Est. Value
About This Home
This home is located at 625 Crown Dr, Bartlesville, OK 74006 and is currently estimated at $184,823, approximately $105 per square foot. 625 Crown Dr is a home located in Washington County with nearby schools including Hoover Elementary School, Madison Middle School, and Bartlesville High School.
Ownership History
Date
Name
Owned For
Owner Type
Purchase Details
Closed on
Apr 27, 2011
Sold by
Anthony Homes Inc
Bought by
Newcomb Michael J and Newcomb Tracie D
Current Estimated Value
Home Financials for this Owner
Home Financials are based on the most recent Mortgage that was taken out on this home.
Original Mortgage
$113,000
Interest Rate
4.87%
Mortgage Type
Future Advance Clause Open End Mortgage
Purchase Details
Closed on
Nov 29, 2007
Sold by
Hammons Norma Jean
Bought by
Anthony Homes Inc
Purchase Details
Closed on
Jan 2, 2004
Sold by
Hammons Norma Jean
Purchase Details
Closed on
Jan 18, 2001
Sold by
Hammons Norma Jean
Purchase Details
Closed on
Sep 12, 2000
Sold by
Hammons Norma Jean
Purchase Details
Closed on
Sep 7, 2000
Sold by
Hammons Robert W and Norma Jean
Purchase Details
Closed on
Jan 6, 1995
Sold by
Hammons Robert W
Purchase Details
Closed on
Oct 30, 1994
Sold by
Secretary Of Veterans Affairs
Create a Home Valuation Report for This Property
The Home Valuation Report is an in-depth analysis detailing your home's value as well as a comparison with similar homes in the area
Home Values in the Area
Average Home Value in this Area
Purchase History
| Date | Buyer | Sale Price | Title Company |
|---|---|---|---|
| Newcomb Michael J | $73,000 | None Available | |
| Anthony Homes Inc | $30,000 | None Available | |
| -- | -- | -- | |
| -- | -- | -- | |
| -- | -- | -- | |
| -- | -- | -- | |
| -- | -- | -- | |
| -- | -- | -- |
Source: Public Records
Mortgage History
| Date | Status | Borrower | Loan Amount |
|---|---|---|---|
| Closed | Newcomb Michael J | $113,000 |
Source: Public Records
Tax History Compared to Growth
Tax History
| Year | Tax Paid | Tax Assessment Tax Assessment Total Assessment is a certain percentage of the fair market value that is determined by local assessors to be the total taxable value of land and additions on the property. | Land | Improvement |
|---|---|---|---|---|
| 2025 | $1,629 | $14,242 | $1,782 | $12,460 |
| 2024 | $1,629 | $13,564 | $1,697 | $11,867 |
| 2023 | $1,629 | $12,919 | $1,677 | $11,242 |
| 2022 | $1,474 | $12,919 | $1,677 | $11,242 |
| 2021 | $1,376 | $11,718 | $1,619 | $10,099 |
| 2020 | $1,340 | $11,160 | $1,592 | $9,568 |
| 2019 | $1,277 | $10,629 | $1,566 | $9,063 |
| 2018 | $1,210 | $10,123 | $1,540 | $8,583 |
| 2017 | $1,179 | $9,641 | $1,515 | $8,126 |
| 2016 | $1,054 | $9,181 | $1,491 | $7,690 |
| 2015 | $1,016 | $8,745 | $1,469 | $7,276 |
| 2014 | $1,029 | $8,745 | $1,469 | $7,276 |
Source: Public Records
Map
Nearby Homes
- 5608 Harvard Dr
- 5610 Baylor Dr
- 6507 Autumn Cir
- 325 Turkey Creek Rd
- 710 Castle Rd
- 6628 Castle Ct
- 6627 Castle Ct
- 317 Autumn Ct
- 4944 Cornell Dr
- 275 Turkey Creek Rd
- 6612 Penny Ln
- 1030 East Dr
- 200 SE Quail Ridge Loop
- 4917 Amherst Dr
- 953 Yale Dr
- 4800 E Frank Phillips Blvd
- 332 Brookline Place
- 5912 Woodland Rd
- 4732 Cornell Dr
- 4701 Dartmouth Dr
- 617 Crown Dr
- 6000 Harvard Dr
- 6015 Harvard Dr
- 622 Crown Dr
- 6001 Harvard Dr
- 611 Crown Dr
- 6100 Harvard Dr
- 616 Crown Dr
- 622 Crestland Dr
- 709 Crown Dr
- 600 Crown Dr
- 700 Crown Dr
- 708 Crestland Dr
- 616 Crestland Dr
- 6015 Cornell Dr
- 5927 Cornell Dr
- 6114 Harvard Dr
- 717 Crown Dr
- 631 Crestland Dr
- 716 Crestland Dr